
Figures & data
Figure 1 Illustration of plasmode data generating process.
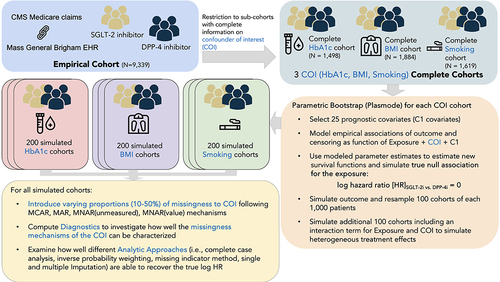
Table 1 Overview of All Plasmode Simulation Parameters. In a First Step, Complete Plasmode Datasets with a Known Underlying Outcome-Generating Model Were Simulated Using an Empirical Exposure, Some Fully Observed Prognostic Factors (C1) and a Confounder of Interest (COI) That Missingness Was Subsequently Imposed on. For Each COI, 200 Plasmode Datasets Were Generated. The Simulated Missingness-Generating Models for the COIs Followed Four Different Missingness Mechanisms in Which the Missing Probability Was the Same for Each Patient (MCAR), Dependent on Observed C1 Covariates (MAR), Dependent on an Unmeasured Confounder (MNAR [Unmeasured]) or Dependent on the COI Itself (MNAR [Value]), Respectively. Besides the COI and the Underlying Missingness Mechanisms, Other Simulation Parameters That Were Altered Involved the Proportion of Missingness That Was Imposed on the COI, the Covariates Included in the Imputation Model and the Presence of Exposure Treatment Effect Modification by the COI
Figure 2 M-graphs depicting structural missing data assumptions and simulated mechanisms. (a) Missing completely at random: MCAR, (b) Missing at random: MAR), (c) Missing not at random, missingness depends on an unmeasured confounder: MNAR(unmeasured) and d) Missing not at random, missingness depends on the value of the confounder of interest itself: MNAR(value). (Notation: C1 = Fully observed C1 confounders used in outcome generation, COI = Confounder of interest [HbA1c, BMI, Smoking], COI_obs = observed portion of COI, E = Exposure, M = Missingness of COI with M=0 fully observed and M=1 fully missing, Y = Outcome).
![Figure 2 M-graphs depicting structural missing data assumptions and simulated mechanisms. (a) Missing completely at random: MCAR, (b) Missing at random: MAR), (c) Missing not at random, missingness depends on an unmeasured confounder: MNAR(unmeasured) and d) Missing not at random, missingness depends on the value of the confounder of interest itself: MNAR(value). (Notation: C1 = Fully observed C1 confounders used in outcome generation, COI = Confounder of interest [HbA1c, BMI, Smoking], COI_obs = observed portion of COI, E = Exposure, M = Missingness of COI with M=0 fully observed and M=1 fully missing, Y = Outcome).](/cms/asset/94447341-df8b-4c06-8d41-42549b89197b/dcle_a_12302931_f0002_c.jpg)
Table 2 Diagnostics to Empirically Differentiate and Characterize Missing Data Mechanisms. The Three Group Diagnostics are Composed of Analytic Models and Tests That Contextualize and Provide Information to Differentiate and Characterize Potentially Underlying Missingness Mechanisms
Table 3 Averaged Simulation Results of Missingness diagnostics Across All Simulated Plasmode Datasets
Table 4 Averaged Simulation Results of Missingness Diagnostics by Proportion Missingness
Figure 3 Panel illustrating (a) root mean squared error (RMSE), (b) % bias and (c) Variance for each analytic missing data method averaged across all simulation scenarios.
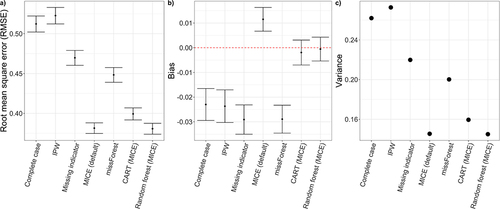
Figure 4 Root mean square error (RMSE) metrics by simulated missingness mechanism.
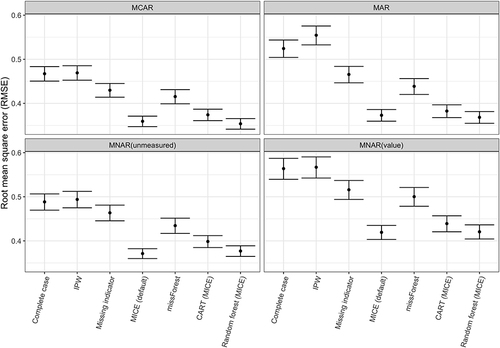
Table 5 Missingness Diagnostics of the Exemplary Base Case Study for Three Blood Laboratory Measurements Representing a Patient’s Baseline Kidney Function. Due to the Expected Monotone Missingness Pattern, the Missingness Diagnostics for One EHR Lab Were Performed in Absence of the Other Two EHR Labs, Except for Little’s Test Which Globally Tests for Presence of MCAR Considering All EHR Labs Jointly
Figure 5 Missingness patternCitation25 of Blood urea nitrogen (bun_results_NA), estimated glomerular filtration rate (egfr_results_NA) and serum creatinine (creatinine_result_NA) in the base case cohort. The set size displays the count of missing observations for each lab result individually while the intersection size illustrates the count of intersecting missing observations across the three labs.
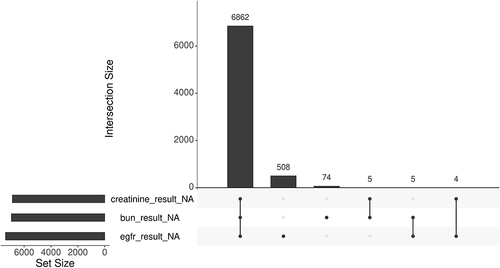
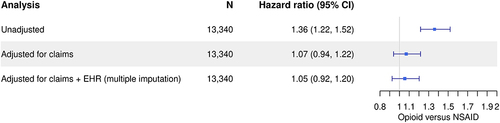
Figure 6 Comparison of results from the empirical case example assessing opioid versus non-steroidal anti-inflammatory drug use on the time to acute kidney injury dependent on level of adjustment.
Data Sharing Statement
Patient-level data cannot be shared due to restriction under our data use agreement with CMS. However, to test the missing data diagnostics and imputation analyses, the smdi R package includes a simulated dataset (smdi_data) with similar missingness structures as the data used in this manuscript. Patient cohorts used in this study were queried using SAS version 9.4 and all analyses were conducted in R version 4.1.2. Detailed information on used packages and versions can be found in the Supplementary Methods and code used in this study is available at https://gitlab-scm.partners.org/drugepi/missingehr. The missing data diagnostics presented in this manuscript can be implemented using the smdi R package, available from https://janickweberpals.gitlab-pages.partners.org/smdi/ and CRAN via install.packages(“smdi”).