
Figures & data
Table 1 Contents of the Better Health in Late Life Questionnaire
Figure 1 The cohort and linked registries.
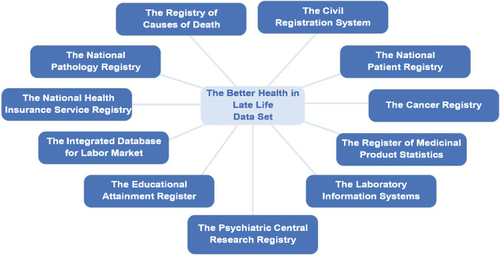
Figure 2 Flowchart.
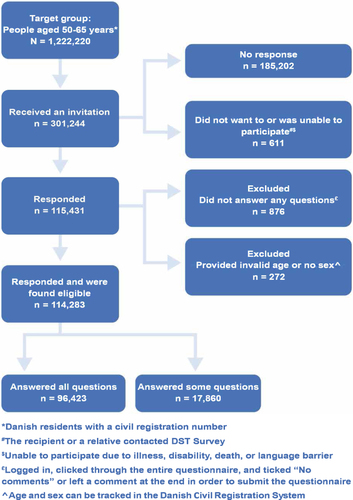
Table 2 Distribution of the Respondents by Age, Lifestyle Factors, and Health-Related Factors
Table 3 Distribution of demographics, Lifestyle Factors, and Health-Related Factors
Table 4 Hospital Diagnoses Among 114,283 Respondents (Grouped According to the Charlson Comorbidity Index) Recorded Up to Five Years Before the Date of the Questionnaire
Table 5 Distribution of Dispensed Prescription Medication Among 114,283 Respondents According to the 12 Main Anatomical, Therapeutic, Chemical (ATC) Classification Groups Recorded Up to One Year Before the Date of the Questionnaire
Table 6 ATC Codes of the 10 Most Commonly Dispensed Prescription Medications Among 114,283 Respondents Recorded Up to One Year Before the Date of the Questionnaire