Figures & data
Table 1 Characteristics of the 3016 hepatitis C virus (HCV) infected patients and the 15,080 controls
Figure 1 Odds ratios for being diagnosed with hepatitis C virus according to employment, income, and educational level.
Note: Odds ratios for each variable are adjusted for the other variables in the figure.
Abbreviations: CCI, Charlson Comorbidity Index; CI, confidence intervals; OR, odds ratio.
Abbreviations: CCI, Charlson Comorbidity Index; CI, confidence intervals; OR, odds ratio.
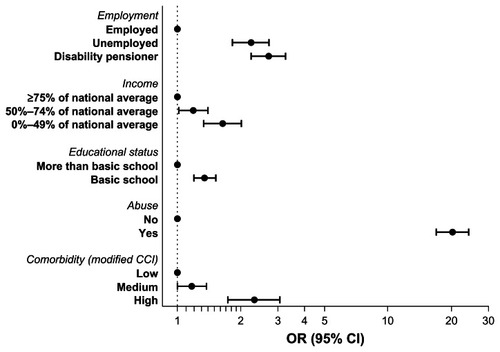
Figure 2 The association between socioeconomic status and survival in hepatitis C virus infected patients.
Note: Associations are expressed as mortality rate ratios, with associated 95% confidence intervals. Mortality rate ratios for each variable are adjusted for the other variables in the figure.
Abbreviations: CCI, Charlson Comorbidity Index; CI, confidence intervals; MMR, mortality rate ratio.
Abbreviations: CCI, Charlson Comorbidity Index; CI, confidence intervals; MMR, mortality rate ratio.
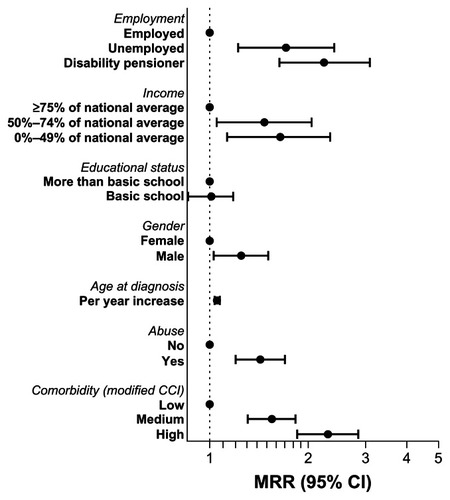
Figure 3 Survival with respect to time (years) after hepatitis C virus diagnosis according to employment and income (the year before diagnosis). The five columns indicate the number of patients at risk in each patient category to the following time points: 0 years, 2 years, 4 years, 6 years and 8 years since study inclusion.
Abbreviation: CI, confidence intervals.
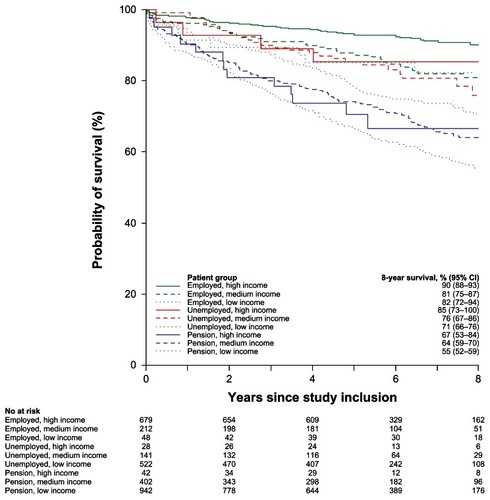
Table S1 Coding algorithm used for comorbid conditions in the Charlson Comorbidity Index