Figures & data
Table 1 Baseline Characteristics in Hypertensive Patients Stratified by BMI Categories
Figure 1 Cumulative incidence rate for all-cause death among hypertensive patients. BMI (kg/m2) was calculated by weight (kg)/height2 (m2); Underweight: <18.5 kg/m2; Normal weight: 18.5–24.9 kg/m2; Overweight: 25.0–29.9 kg/m2; Obesity: ≥30.0 kg/m2.
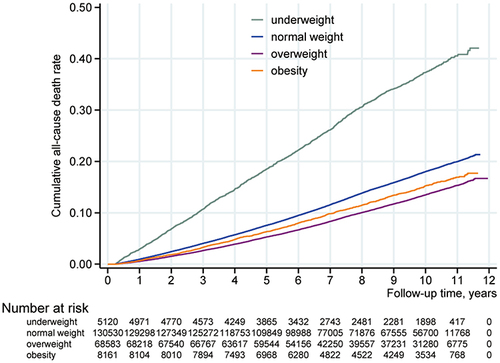
Table 2 The Effect of Different BMI Groups on All-Cause Mortality by Cox Proportional Hazard Regression Models
Figure 2 Exposure-response curves for the independent effects of BMI and age among hypertensive patients. (a) Independent effect of age; (b) Independent effect of BMI. Adjusting for sex, systolic blood pressure, diastolic blood pressure, physical exercise, smoking, drinking, diabetes mellitus, family history of hypertension, family history of diabetes mellitus, family history of cardiovascular disease, and family history of stroke.
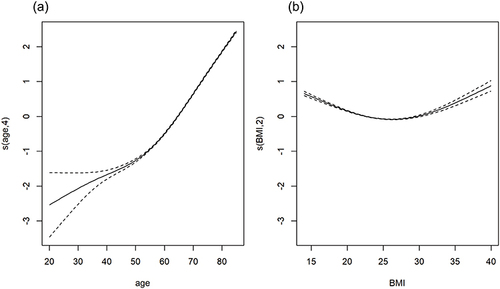
Figure 3 Exposure–response curves for the independent effect of BMI on all-cause mortality among hypertensive patients stratified by age group. (a) 20–44 years old; (b) 45–59 years old; (c) 60–85 years old. Adjusting for sex, systolic blood pressure, diastolic blood pressure, physical exercise, smoking, drinking, diabetes mellitus, family history of hypertension, family history of diabetes mellitus, family history of cardiovascular disease, and family history of stroke.
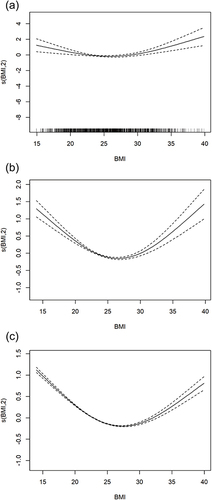
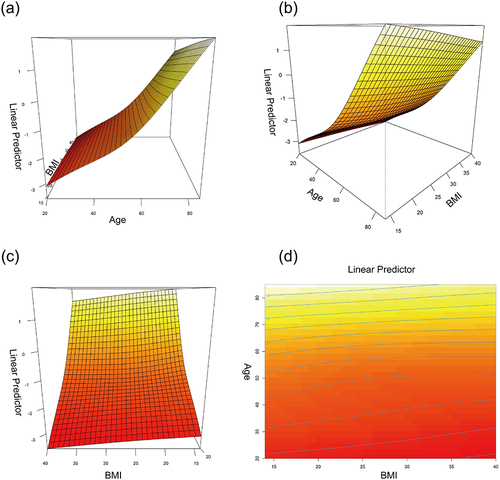
Figure 4 Different angles of exposure–response surface plots of the joint effect of BMI and age on all-cause mortality among hypertensive patients. The plots (a–c), and (d) represent the different angles. Adjusting for sex, systolic blood pressure, diastolic blood pressure, physical exercise, smoking, drinking, diabetes mellitus, family history of hypertension, family history of diabetes mellitus, family history of cardiovascular disease, and family history of stroke.