
Figures & data
Table 1 Individual IMID-Specific Algorithms Retrieved from the Literature
Figure 1 Flow chart of incident biological drug users included in the study.
Abbreviations: ETP, Electronic therapeutic plans; ID, Index date; IMID, Immune-mediated inflammatory disease.
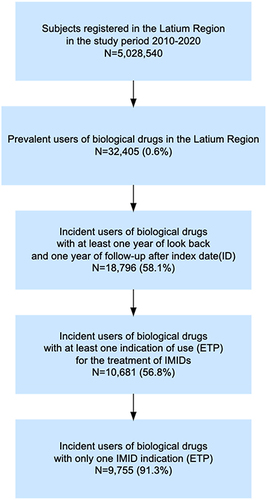
Table 2 Validity Estimates of the META-Algorithm According to the Main Analysis
Figure 2 Percentage of indications of use assigned by the META-algorithm against the reference standard.
Abbreviations: CD, Crohn’s disease; PsO, Psoriasis; PsA, Psoriatic arthritis; RA, Rheumatoid arthritis; SpA, Spondyloarthritis; UC, Ulcerative colitis.
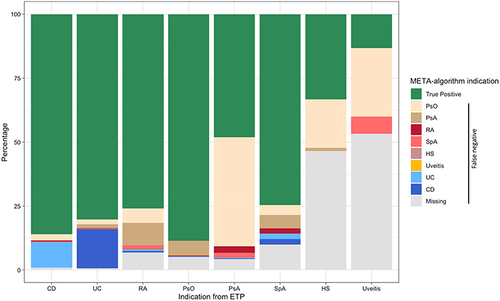
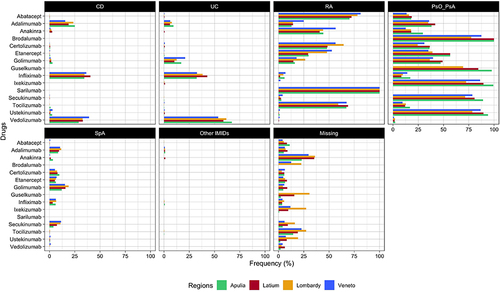
Figure 3 Frequency (%) of indication of use stratified by single biological drug across regions (Apulia, Latium, Lombardy, and Veneto).
Note: *Other IMIDs: HS and Uveitis.
Abbreviations: CD, Crohn's disease; UC, Ulcerative colitis; RA, Rheumatoid arthritis; PsO, Psoriasis; PsA, Psoriatic arthritis; SpA, Spondyloarthritis.
Data Sharing Statement
All available data are included in the manuscript and in the Supplementary Materials.