Figures & data
Table 1 Baseline characteristics of patients at the time of cancer diagnosis for this study from 2000–2022
Figure 1 Age-standardised annual incidence (per 100,000 person years) for nine cancers from 2000 to 2022 (red line indicating start of COVID pandemic in 2020). Grey bands indicate 95% CIs.
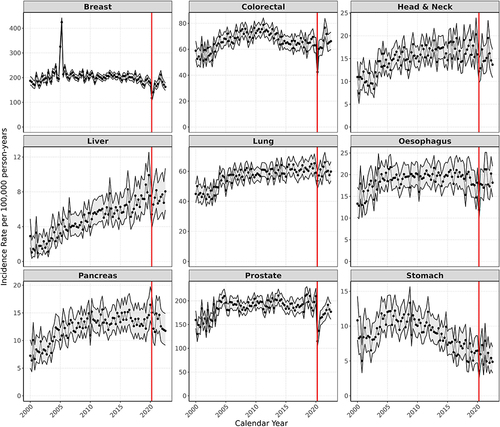
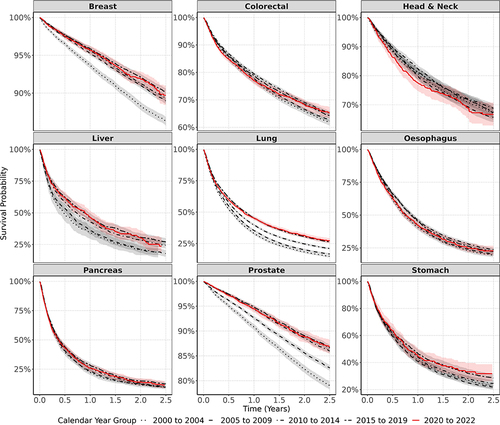
Table 2 Survival probabilities (and 95% CIs) for all cancer outcomes at one and two years after diagnosis stratified by calendar year group
Figure 2 Kaplan–Meier survival curves for all nine cancers stratified by calendar time of cancer diagnosis. Shaded bands indicate 95% CIs.