
Figures & data
Table 1 Characteristics of the Frozen Shoulder Cohort, the General Population Comparison Cohort, and the Back Pain Comparison Cohort
Figure 1 Cumulative incidence plot. Cumulative incidence of death from index date and over 20 years of follow up for the cohort of population comparators, the frozen shoulder cohort, and the back pain cohort. Curves were smoothed for data protection.
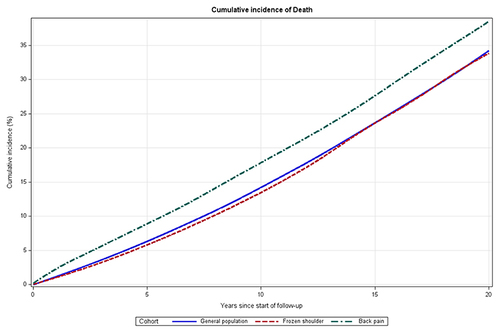
Table 2 Cumulative Incidence of Parkinson’s Disease
Figure 2 Cumulative incidence plot. Cumulative incidence Parkinson’s disease from index date and over 20 years of follow up for the cohort of population comparators, the frozen shoulder cohort, and the back pain cohort. Curves were smoothed for data protection.
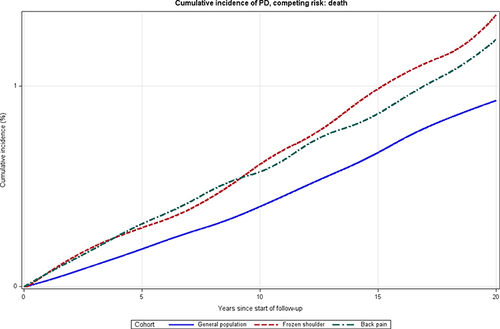
Table 3 Incidence Rates and Hazard Ratios for Parkinson’s Disease, Comparing the Frozen Shoulder Cohort to the General Population and Back Pain Cohorts
Data Sharing Statement
To protect the privacy of patients, it is by Danish law prohibited to make individual-level data publicly available.