
Figures & data
Figure 1 Identification of coefficients in the simulated personal symptom networks.
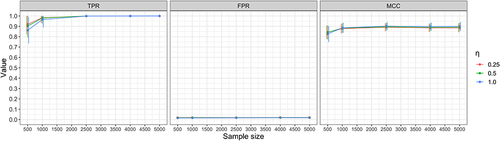
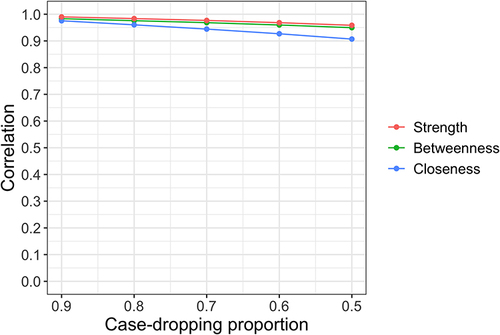
Figure 2 Correlation of centrality metrics (strength, betweenness, and closeness) between the original sample and subsets with different case-dropping proportions. The definition of the stable and unstable network structure can be found in the Supplementary Materials.
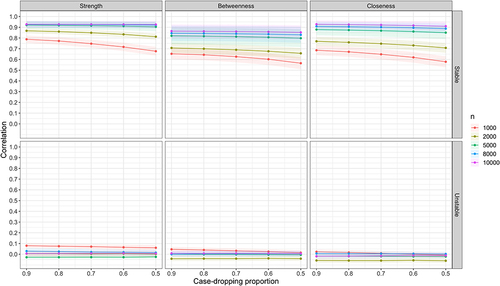
Figure 3 Type I error of testing the differences of edges and centralities for the estimated personal symptom networks.
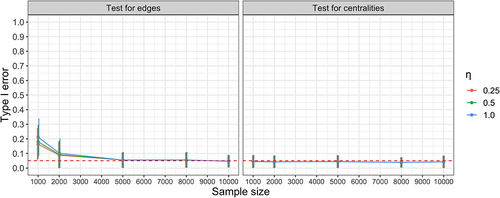
Table 1 Sociodemographic Characteristics, Cancer Diagnoses, Treatments, and the Presence of 10 Symptom Domains Among 1,708 Adult Survivors of Childhood Cancer Participating in the SJLIFE Study Between 2007 and 2020. Mean (Standard Deviation (SD)) Was Reported for the Numeric Variable and Number (%) Was Reported for Categorical Variables
Figure 4 The identified pairwise associations between symptoms of the personal symptom network estimated based on the adult survivors of childhood cancer from SJLIFE. The edge name “Y1-Y2” represents the identified association between symptoms Y1 and Y2 independent of individual characteristics, and the edge name “Y1-Y2:X” represents the identified association between symptoms Y1 and Y2 influenced by individual characteristic X. The black dots represent the average point estimates, and the lines represent the corresponding 95% CIs.
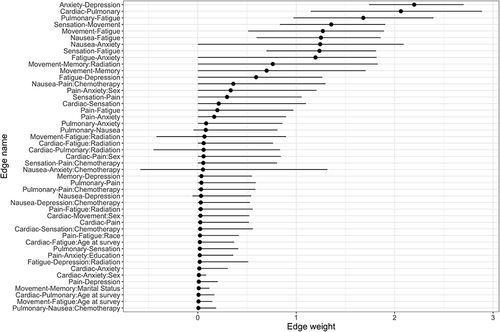
Figure 5 The estimated personal symptom network for two individual cancer survivors: (a) a White non-Hispanic male, aged 30.9 years (overall mean age) at the survey with below college/post-graduate education, ever married or lived as married, and never received chemotherapy and/or radiation, and (b) a racial/ethnic minority female, aged 39.5 years (one SD above the mean) at the survey with above college/post-graduate education, never married or lived as married, and received chemotherapy and radiation. Edges pointed to by arrows with covariates indicate the influence of covariates on the pairwise associations between symptoms.
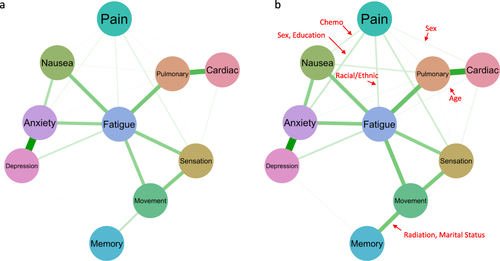
Figure 6 Values of centrality indices (strength, betweenness, and closeness) in the representative personal symptom network for person 1: a White non-Hispanic male, aged 30.9 years at the survey with below college/post-graduate education, ever married or lived as married, and never received chemotherapy and/or radiation, and person 2: a racial/ethnic minority female, aged 39.5 years at survey with above college/post-graduate education, never married or lived as married, and received chemotherapy and radiation.
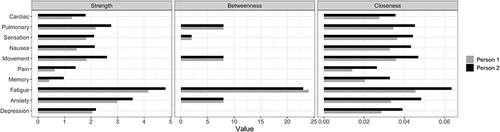
Figure 7 Correlations of centrality metrics in case-dropping bootstrap testing for the personal symptom network estimated based on the adult survivors of childhood cancer from SJLIFE.
Data Sharing Statement
The deidentified data will be publicly available on Zenodo.org.