Figures & data
Table 1 Distribution of breast cancer patients diagnosed between 2000 and 2011 by CCI score in four calendar time periods
Table 2 One- and 5-year survival and relative mortality stratified by four calendar time periods and age group of breast cancer diagnosis
Figure 1 Kaplan–Meier survival curves for breast cancer patients in four calendar time periods stratified by Charlson Comorbidity Index score.
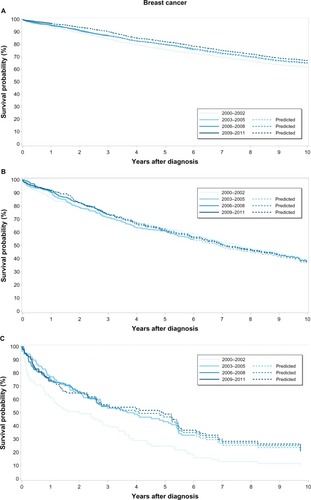
Table 3 One- and 5-year survival and relative mortality for patients diagnosed with breast cancer in four calendar time periods stratified by Charlson Comorbidity Index score
Table S1 Specification of Charlson diseases, International Classification of Diseases (ICD)-8 and ICD-10 codes, and the Charlson weight
Table S2 Distribution of breast cancer patients diagnosed between 2000 and 2011 by individual Charlson disease in four calendar time periods