Figures & data
Table 1 Characteristics of colon and rectal cancer patients in the Central Region of Denmark 2000–2011
Table 2 Overall survival and mortality rate ratios after colon and rectal cancer according to diagnostic calendar periods in the Central Region of Denmark 2000–2011
Figure 1 Kaplan–Meier curves for colon cancer patients in the Central Region of Denmark for four diagnostic periods for (A) Charlson score = 0, (B) Charlson score = 1–2, and (C) Charlson score = 3+.
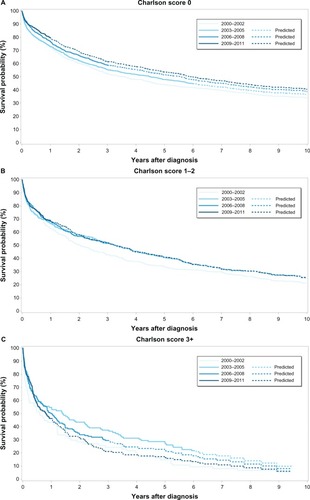
Table 3 One-year and 5-year survival and relative mortality after colon cancer according to comorbidity level for each diagnostic period in the Central Region of Denmark 2000–2011
Figure 2 Kaplan–Meier curves for rectal cancer patients in the Central Region of Denmark for four diagnostic periods for (A) Charlson score = 0, (B) Charlson score = 1–2, and (C) Charlson score = 3+.
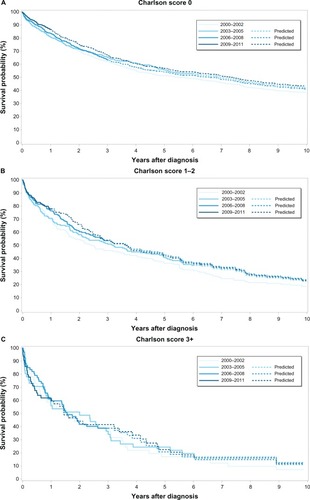
Table 4 One-year and 5-year survival and relative mortality after rectal cancer according to comorbidity level for each diagnostic period in the Central Region of Denmark 2000–2011