Figures & data
Figure 1 Components of the Children’s Treatment Network versus usual care.
Abbreviations: CTN, Children’s Treatment Network; RCT, randomized controlled trial; REB, research ethics board.
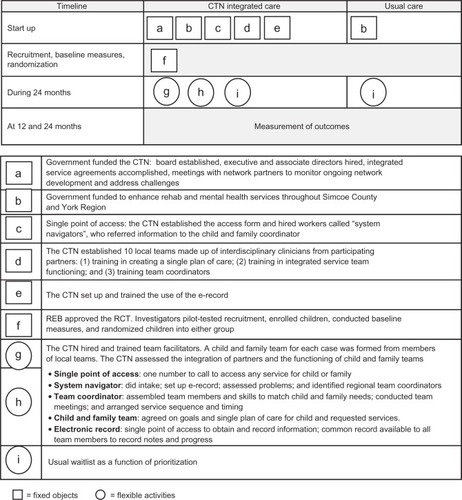
Figure 2 Summary of different analytical approaches.
Abbreviation: PS, propensity score.
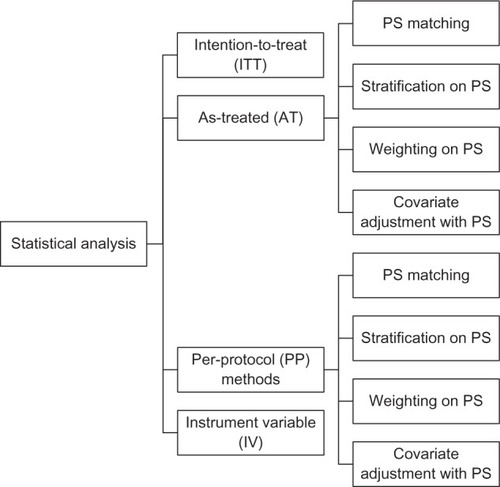
Figure 3 Flow of children in the Children’s Treatment Network trial.
Abbreviation: CTN, Children’s Treatment Network.
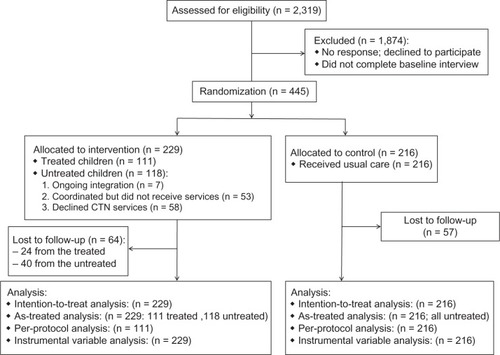
Table 1 Baseline characteristics
Table 2 Comparing treated with untreated children in the intervention group
Figure 4 Comparing the estimates of treatment effect from different analyses.
Note: Mean difference refers to the difference in the change in psychosocial score in 2 years between groups.
Abbreviations: ITT, intention-to-treat; AT, as-treated; PP, per-protocol; IV, instrumental variable; PS, propensity score.
Abbreviations: ITT, intention-to-treat; AT, as-treated; PP, per-protocol; IV, instrumental variable; PS, propensity score.
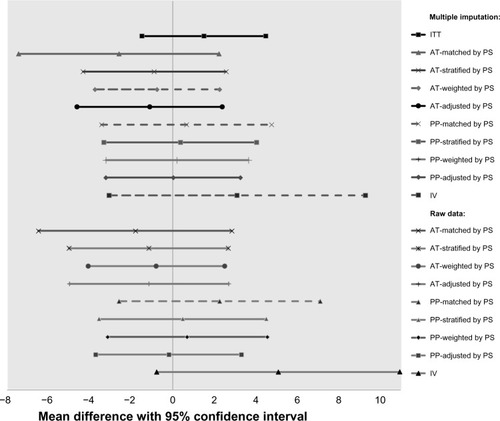
Table 3 Summary of estimates of treatment effect