
Figures & data
Table 1 Hormonal replacement modalities
Table 2 Organ transplantation rates
Figure 1 Predicted margins of the logits or LS-means estimated from each logistic regression model based on the successful procurement/transplantation rates for each organ across hormonal replacement regimen groups.
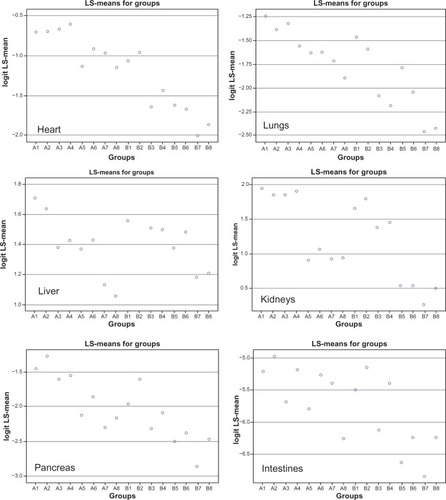
Figure 2 Dunnett’s MCC simultaneous confidence intervals for the differences of the LS-means estimated from each logistic regression model using multiple comparisons with the highest LS-mean across hormonal replacement regimen groups.
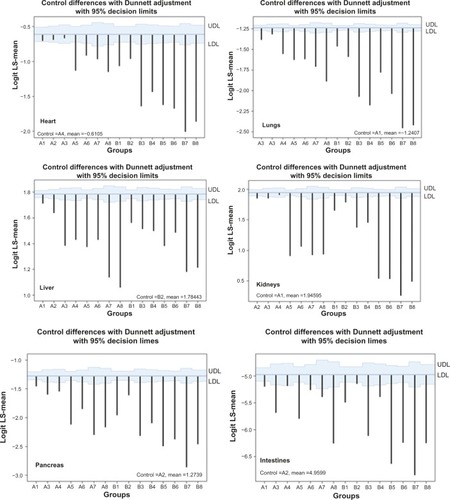
Figure 3 Hsu’s MCB simultaneous CIs for the differences of the LS-means estimated from each logistic regression model using multiple comparisons with the best LS-mean across hormonal replacement regimen groups.
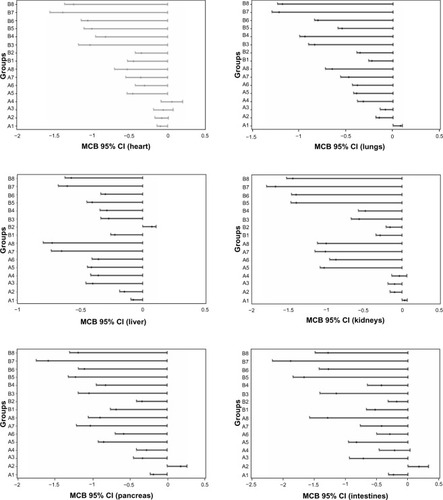
Figure 4 Pair-wise confidence intervals from generalized linear mixed models with four different covariance structures using the Tukey–Kramer procedure across hormonal replacement regimen groups.
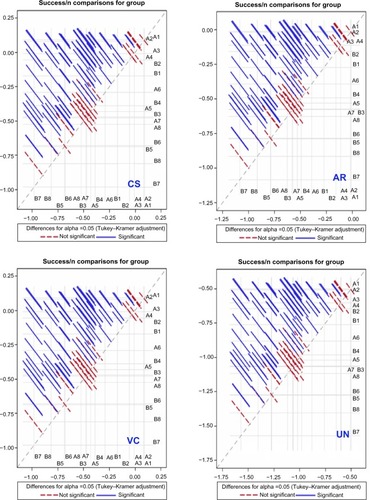
Table 3 LS-means estimated from different covariance structure models
Figure 5 Simultaneous confidence intervals for the differences of the LS-means estimated from generalized linear mixed models with four different covariance structures using the Dunnett–Hsu procedure across hormonal replacement regimen groups.
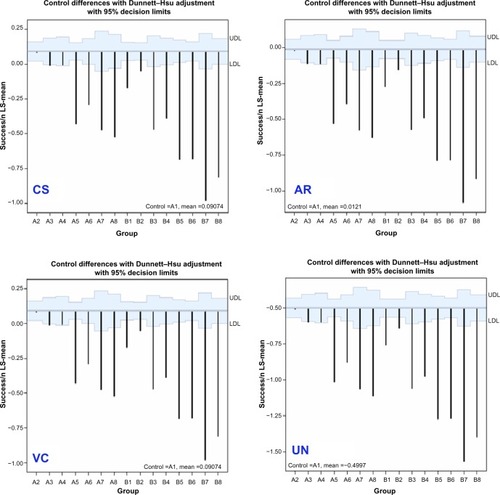
Figure 6 LS-means and the simultaneous confidence intervals for the differences from generalized linear model based on the average number of organs procured from each donor using the Dunnett–Hsu MCC procedure (upper panels) and the Hsu MCB procedure (lower panels) across hormonal replacement regimen groups.
Abbreviations: BMI, body mass index; CI, confidence interval; LDL, lower decision limit; LS, least square; MCB, multiple comparisons with the best; MCC, multiple comparisons with control; NumOrg, number of organs; UDL, upper decision limit.
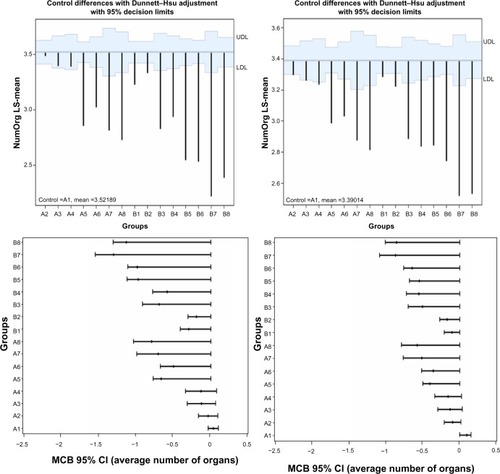
Table 4 Optimal hormonal replacement modalities to maximize organ transplantation