Figures & data
Table 1 Grouping of diagnoses and interventions used for classifying hospital activities by complication groups of relevance for diabetes and with respect to diagnostic specificity for diabetes
Figure 1 An illness-stage–death model with three categories of complications as the framework for epidemiological analysis.
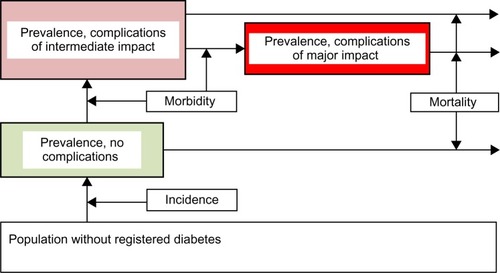
Table 2 Summary of data by complication group
Figure 2 Standardized incidence rate of diabetes, 2000–2011, (per 100,000 person-years).
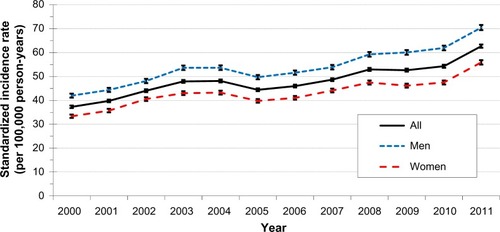
Figure 3 Standardized rate of developing complications, 2000–2011, (per 100 person-years).
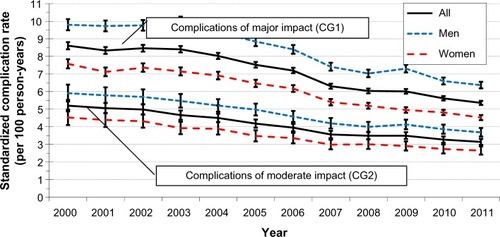
Figure 4 Standardized mortality rates by complication group, 2000–2011, (per 100 person-years).
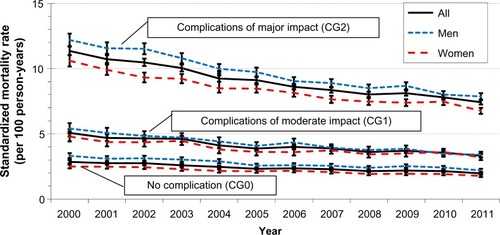
Figure 5 Overall standardized prevalence proportions from the end of 1999 to the end of 2011, (per 1,000 population).
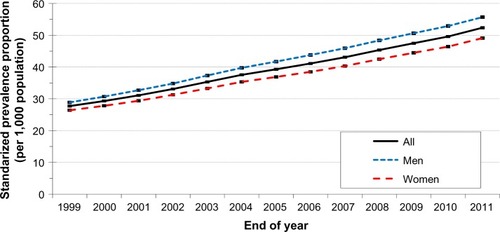
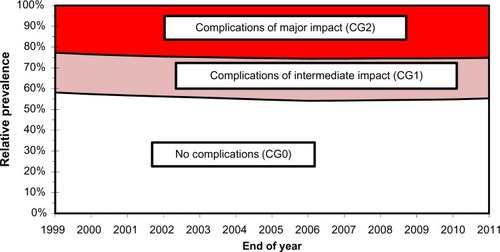
Figure 6 Relative prevalence by complication group from the end of 1999 to the end of 2011.