
Figures & data
Table 1 Inclusion and exclusion criteria in the COLOFOL trial
Figure 1 Consort diagram of the COLOFOL trial.
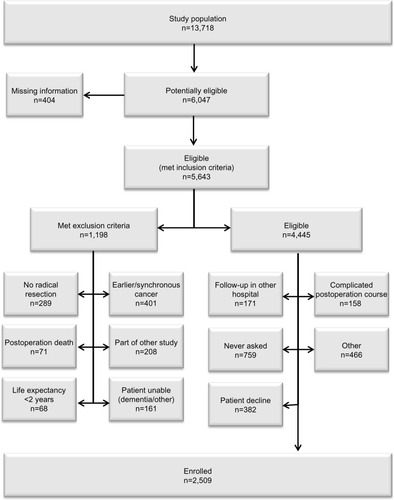
Figure 2 Randomized and eligible patients per center.
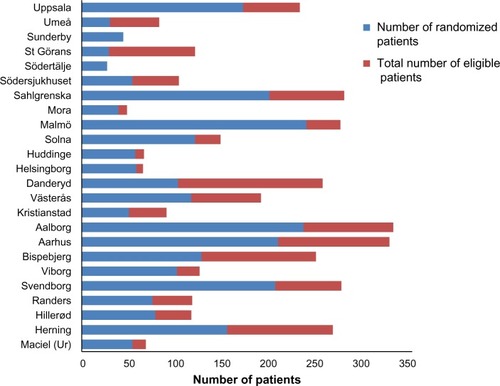
Figure 3 Inclusion rate.
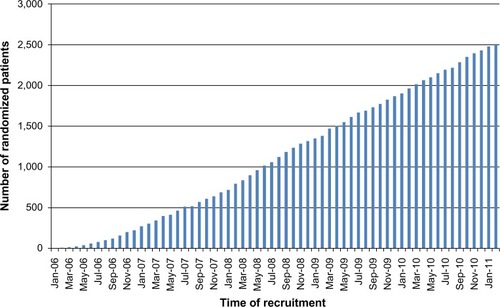
Table 2 Demography of randomized patients and eligible but nonrandomized patients in four major hospitals, n=1,221