
Figures & data
Figure 1 A flowchart of the literature searches for the systematic review of studies on the incidence of mediastinitis.
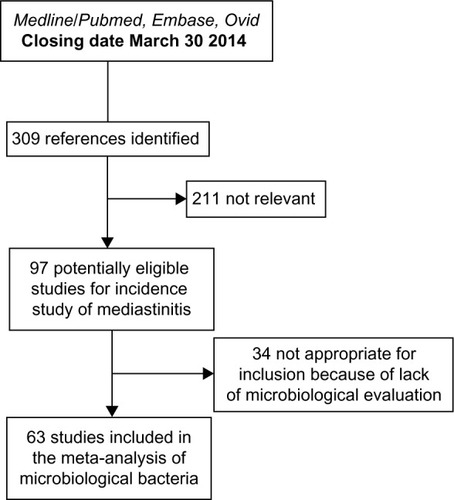
Table 1 Incidence of microorganisms recovered in mediastinitis secondary to cardiothoracic surgery with frequency in 63 cohort studies
Table 2 Estimate of incidence of mediastinitis with stratification on prospective nature and power of the cohort and on latitude of the study place using the random-effect model
Table 3 Meta-regression between incidence of mediastinitis and the different study-level and patient-level variables in a univariate analysis
Figure 2 A funnel plot for the incidence of mediastinitis in 97 studies with Egger line.
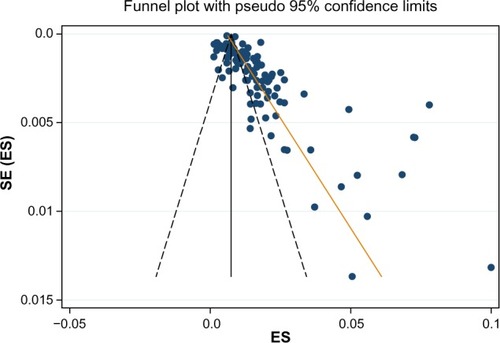
Figure 3 Meta-regression of incidence of mediastinitis and latitude of study place.
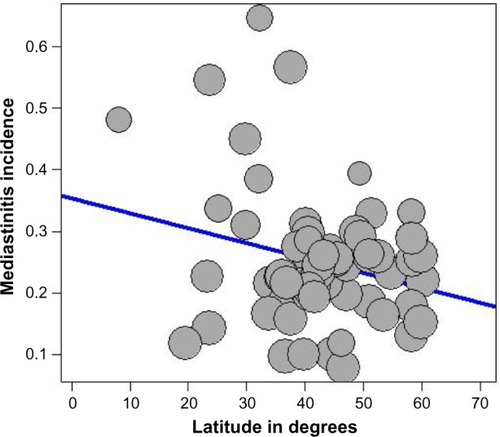
Figure 4 Meta-regression of incidence of mediastinitis and mean age of the patient.
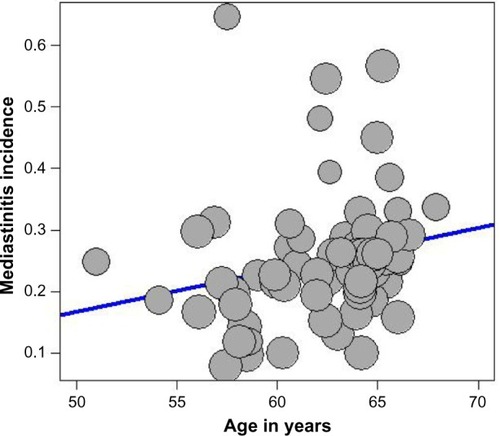
Table 4 Estimate of incidence of Gram-positive cocci with stratification on prospective nature of the cohort and latitude of the study place using the random-effect model
Table 5 Meta-regression model between incidence of Gram-positive cocci and the different study-level and patient-level variables in a univariate analysis using the 63 cohorts
Table 6 Estimate of total incidence of MRSA with stratification on prospective nature of cohort and latitude of the study place using the random-effect model
Table 7 Meta-regression model between incidence of MRSA and the different study-level and patient-level variables in a univariate analysis using the 63 cohorts
Figure 5 Meta-regression of incidence of MRSA and latitude of the study place.
Abbreviation: MRSA, methicillin-resistant Staphylococcus aureus.
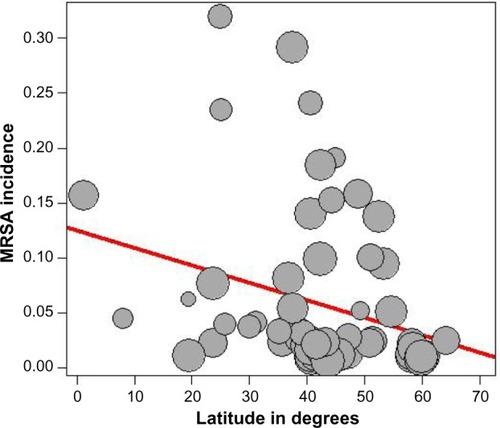
Figure 6 Meta-regression of incidence of MRSA and mean age of the patient.
Abbreviation: MRSA, methicillin-resistant Staphylococcus aureus.
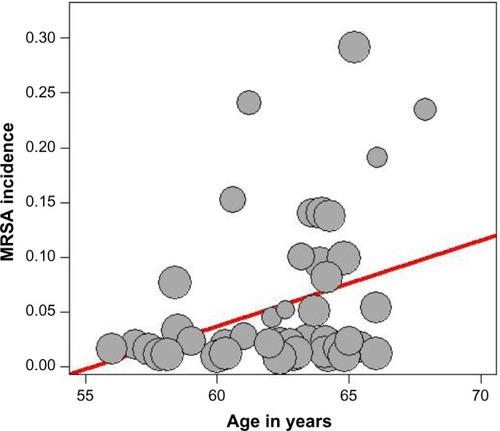
Table 8 Estimate of total incidence of Gram-negative bacilli with stratification on prospective nature of cohort and latitude of the study place using the random-effect model
Table 9 Meta regression model between incidence of Gram-negative bacilli and the different study-level and patient-level variables in a univariate analysis using the 63 cohorts