
Figures & data
Table 1 Main variables included in the DMD
Figure 1 Regional performance regarding indicator 3 (excisional margins according to guidelines).
Notes: The blue dots present the result for each region and Denmark as a whole (with 95% confidence limits) for quality indicator 3: the fraction of tumors where excisional margins are performed according to the guidelines. The vertical dotted line shows the standard set as an aim of acceptance for the indicator by the DMD steering committee. Data from Dansk Melanom Database.Citation4
Abbreviation: DMD, Danish Melanoma Database.
Abbreviation: DMD, Danish Melanoma Database.
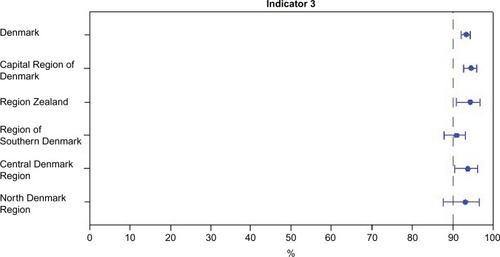
Figure 2 Age-standardized incidence rates from the DMD (full lines) compared with age-standardized incidence rates from the NORDCANa (dotted lines).
Notes:
aNORDCAN is a collaboration of the cancer registries in the Nordic countries. Data, which can be accessed online in an open version, are derived from the national cancer registries and slightly modified to be comparable. Data from Engholm et al.Citation17
Abbreviations: DMD, the Danish Melanoma Database; py, per year; DMG, Danish Melanoma Group.
Abbreviations: DMD, the Danish Melanoma Database; py, per year; DMG, Danish Melanoma Group.
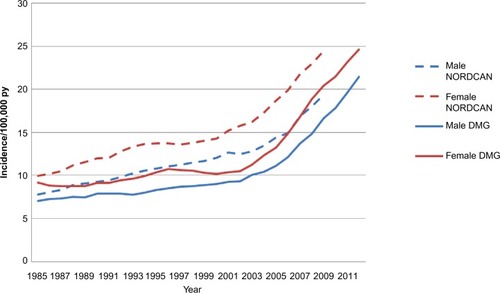
Table 2 Current key indicators for the DMD