
Figures & data
Figure 1 The amount of patients registered in the Danish Sarcoma Database every year since the start of the database.
Note: The increase in the amount of patients from the first 5 years to 2014 is mainly due to a more complete registration of extraskeletal sarcomas.
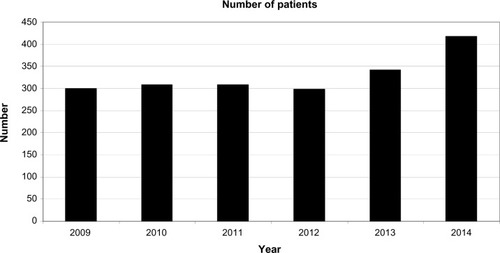
Figure 2 The relative distribution of patients related to age.
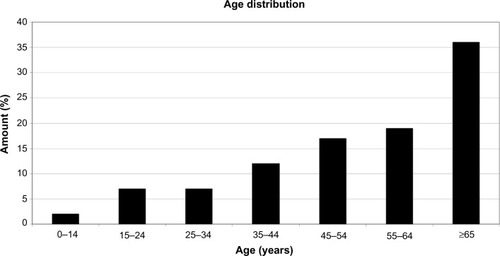
Table 1 The mean age for each year included in the sarcoma database
Figure 3 The distribution of malignancy grade among sarcomas registered in the Danish Sarcoma Database.
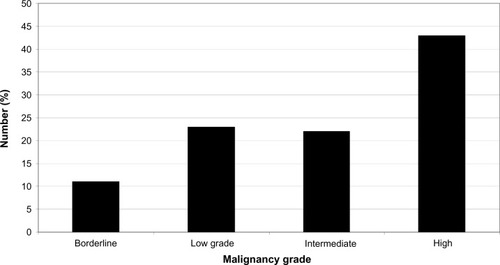
Table 2 Variables of the sarcoma database
Table 3 Quality indicators with standards