
Figures & data
Figure 1 Danish cervical cancer incidence (red curve) and mortality (green curve) 1943–2013 (0–85 years of age).
Notes: Age-standardized rate per 100,000 (Nordic standard population). In 1967, start of first organized county-based screening program; 1986, first national guidelines issued; 2007, new national guidelines issued; and 2012, updated national guidelines issued. Reproduced from Engholm G, Ferlay J, Christensen N, et al. NORDCAN: Cancer Incidence, Mortality, Prevalence and Survival in the Nordic Countries, Version 7.2 (16.12.2015). Association of the Nordic Cancer Registries. Danish Cancer Society. Available from http://www.ancr.nu. Accessed March 16, 1016.Citation13
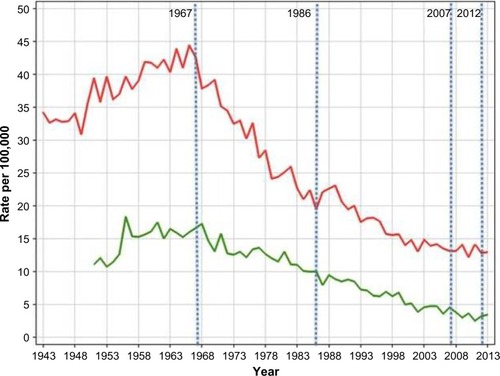
Table 1 Quality indicators, standards, and achieved outcomes in 2009–2014 for the Database for Cervical Cancer Screening in Denmark