
Figures & data
Figure 1 MAGIC trial AC subgroup CONSORT diagram.
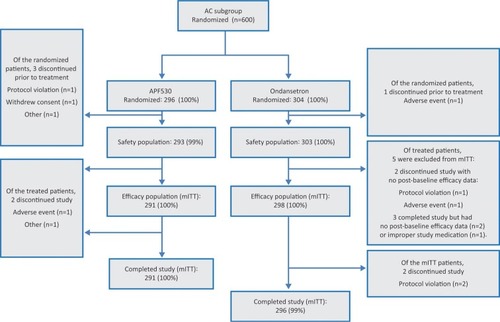
Table 1 Patient demographics and baseline characteristics in patients receiving AC-based regimens (mITT population)
Table 2 Chemotherapy regimens in patients receiving AC-based regimens (mITT population)
Table 3 Complete response, complete control, and total response during delayed, overall, and acute CINV in patients receiving AC-based regimens (mITT population)
Table 4 Patients with no rescue medication use by CINV phases in patients receiving AC-based regimens (mITT population)Table Footnotea
Table 5 Patients with no nausea by CINV phases in patients receiving AC-based regimens (mITT population)Table Footnotea
Table 6 TEAEs occurring in ≥10% of patients in any arm receiving AC-based regimens (safety population)