Figures & data
Figure 1 (A, B) Microscopic photos of HemSCs and HUVECs that were cultured in vitro; (C) growth curve of HUVECs and HemSCs and (D) MTT assay for cells being treated with E2 over 48 h.
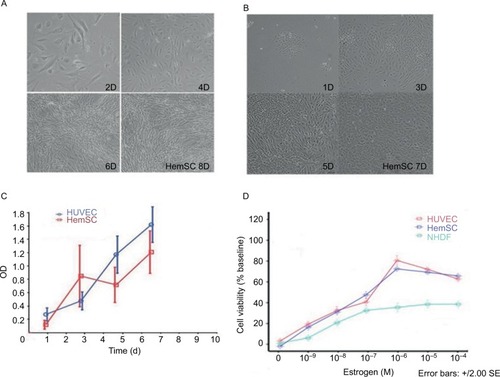
Figure 2 (A) Real-time PCR analysis of VEGF-A mRNA transcript levels; (B) RT-PCR showing increase in mRNA expression of VEGF-A with increasing concentration of E2 (*P<0.05); (C) ELISA of VEGF-A and FGF2 in supernatants of HemSCs treated with different concentrations of E2. Note the dose-dependent promotion of VEGF-A and FGF2 secretion and (D) Western blot of VEGF-A and FGF2 protein in HemSCs treated with different concentrations of E2.
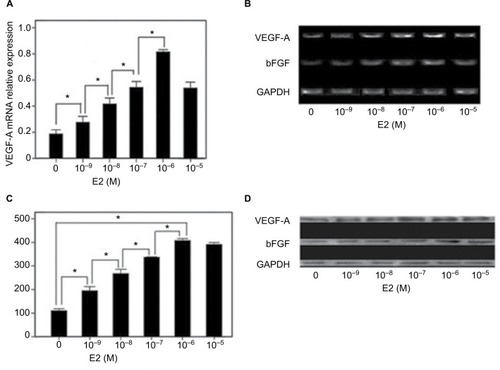
Table 1 Volume of tumor (mm3)
Table 2 Results of MVD in 5 groups (mm2)
Figure 3 (A–C) E2 induces tumorigenesis in the in vivo IH model (1W, 2W and 4W); (D–F) representative H&E-stained section (1W, 2W and 4W, ×200); (G, H) representative H&E-stained section (1W and 2W, ×400); (I) statistical comparison of MVD in murine tumor tissue (*P<0.05); (J–L) immunohistochemical staining of Glut-1 (1W, 2W and 4W).
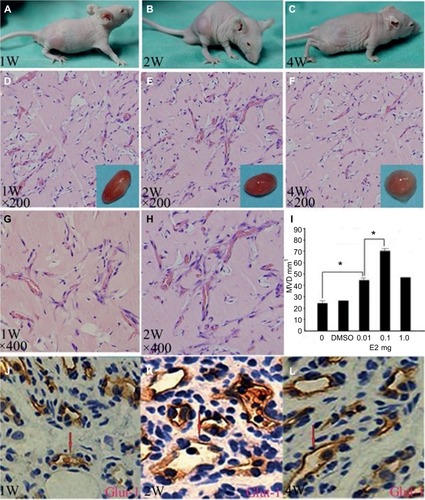
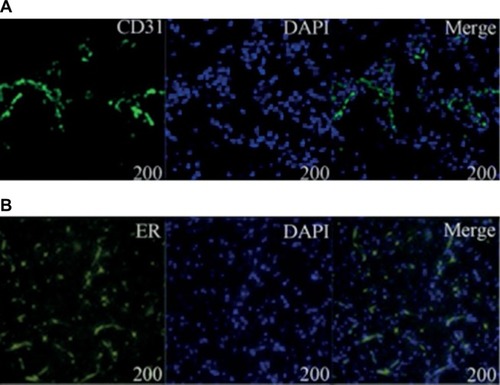
Figure 4 (A, B) Laser scanning confocal microscope of CD31 and ER-α. Immunofluorescence analysis showed that DAPI was stained blue in the nucleus and CD31 and ER-α were positively expressed in the cytomembrane.