Figures & data
Table 1 Overview of miR-34a roles in cancers
Figure 1 Study flowchart showing the inclusion and exclusion criteria and the entire study design.
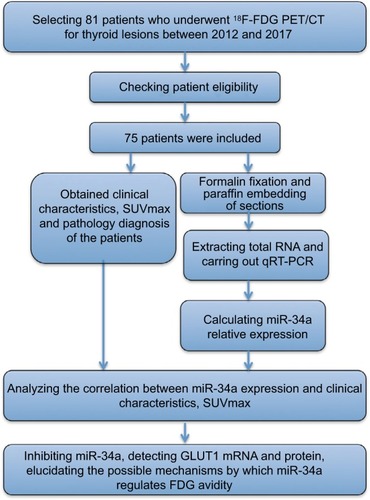
Table 2 miR-34a expression in thyroid lesions and clinical characteristics
Figure 2 qRT-PCR results of miR-34a relative expression and the relationship between miR-34a expression and clinical characteristics in enrolled patients. Analysis of miR-34a relative expression by qRT-PCR. The results are shown as 2−ΔΔCt and normalized to U6. There is no difference in the relative expression of miR-34a between patients of different ages and genders, with different lesion numbers and locations of lesions (data not shown). (A) Patients with higher tumor stage harbored lower miR-34a expression (P < 0.001), while (B) patients with malignant thyroid lesions expressed higher miR-34a than those with goiter (P < 0.0001). We also analyzed the miR-34a expression among different malignant pathology types and found that there is no significant difference among FTC, MTC and ATC. (C) However, tendency shows that ATC harbored lower miR-34a compared to other groups. (D) miR-34a expression was significantly higher in patients with low SUVmax (SUVmax ≤ 3.63) than in those with higher SUVmax (SUVmax >3.63, P < 0.0001). ***P < 0.001.
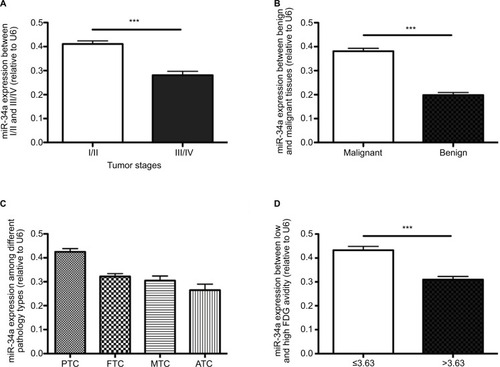
Figure 3 Graphs show the relationship between miR-34a expression and SUVmax in patients with thyroid diseases. (A) There was an inverse relationship between miR-34a expression and SUVmax in patients with thyroid diseases (Spearman correlation coefficient = −0.553, P < 0.0001). (B) ROC curve analysis of SUVmax to predict miR-34a expression. The miR-34a expression was divided into 2 different groups, named as miR-34a-L (whose miR-34a expression is lower than or equal to 0.36) and miR-34a-H (miR-34a expression is higher than 0.36). With an SUVmax of 4.3 as the threshold, sensitivity and specificity of the prediction of miR-34a expression (low or high) were 70% and 94.3%, respectively. The area under the ROC curve was 0.843 (95% confidence interval: 0.749, 0.936; P = 0.001).
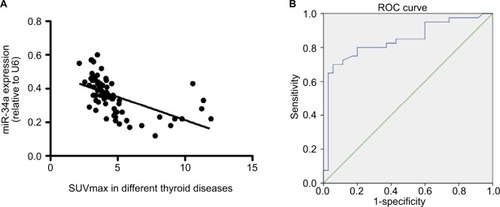
Figure 4 Inhibiting miR-34a expression increased GLUT1 expression. Graphs show the influence of miR-34a inhibition on glucose transporters in cultured TPC-1 cells. miR-34a may decrease 18F-FDG uptake via targeting GLUT1 expression. Data are mean ± standard deviation. (A) miR-34a inhibitor successfully downregulated the miR-34a expression (P < 0.001), while there is no significant statistical difference between TPC-1 and NC group (P > 0.05). (B and C) Influence of miR-34a inhibition on expression of GLUT1 mRNA and protein in TPC-1 cells. miR-34a inhibition significantly increased expression of GLUT1 mRNA and protein (both P < 0.001). ***P < 0.001.
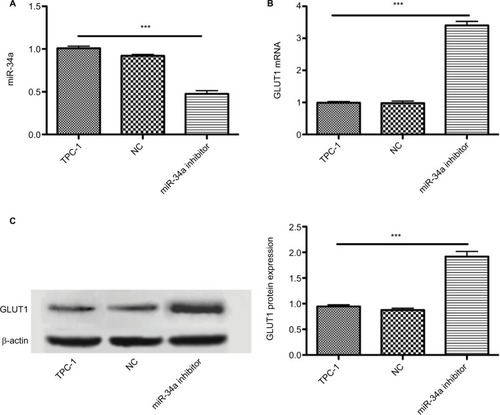
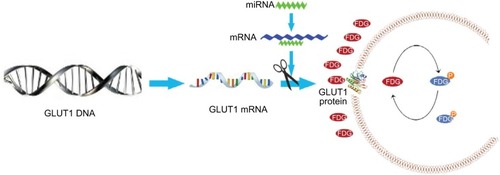
Figure 5 Models show the possible metabolic status in thyroid cancer with different miR-34a expression. miR-34a expression in ATC was lower than that in differentiated thyroid carcinoma, which cannot inhibit the GLUT1 expression, leading to increased FDG avidity. The glycolysis pathway, including 18F-FDG uptake, was upregulated in patients with ATC. Thus, SUVmax was significantly higher in patients with ATC.