Figures & data
Table 1 Main characteristics of the patients analyzed
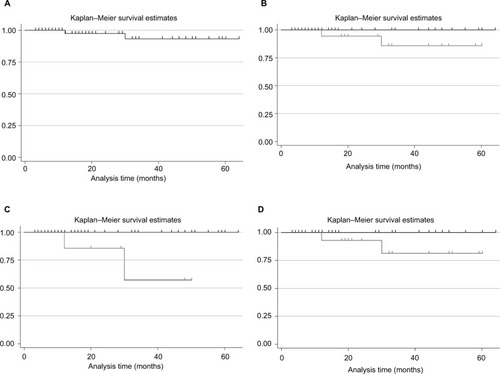
Figure 1 Kaplan–Meier toxicity-free survival estimates.
Notes: (A) Late toxicity-free survival in the overall population; (B) late toxicity-free survival stratified for treatment received (RT, black line vs RT+HT, gray line); (C) acute toxicity-free survival in the overall population; (D) acute toxicity-free survival stratified for treatment received (RT, black line vs RT+HT, gray line).
Abbreviations: HT, hormonal therapy; RT, radiotherapy.
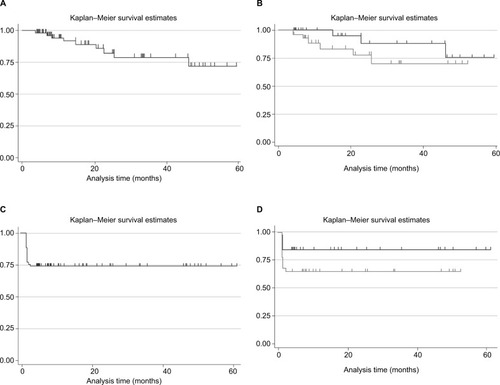
Table 2 Multivariate analysis (Cox model) for acute toxicity
Table 3 Multivariate analysis (Cox model) for late toxicity
Figure 2 Kaplan–Meier survival estimates in the overall population (A), or stratified for: (B) treatment received (RT, black line vs RT+HT, gray line); (C) presence of at least one positive lymph node (0, black line vs 1+, gray line); (D) PSA value (<10, black line vs ≥10, gray line).
Abbreviations: HT, hormonal therapy; PSA, prostate-specific antigen; RT, radiotherapy.