
Figures & data
Figure 1 Representative sections of lung adenocarcinoma tissues with cytoplasmic staining for Cox-2. (A) High expression; (B) low expression.
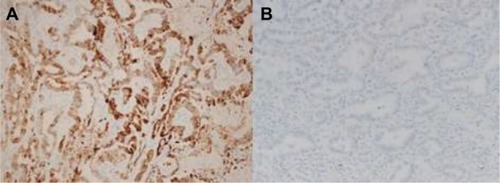
Figure 2 Representative sections of lung adenocarcinoma tissues with CD8-positive TILs and cell membrane staining for PD-L1 according to tumor immune microenvironment classification.
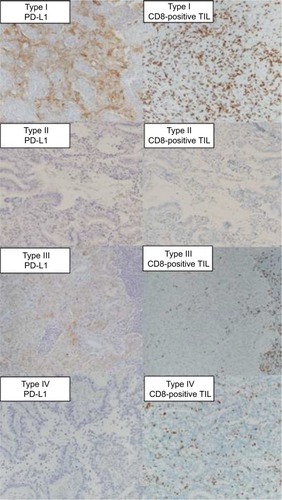
Table 1 Relationship between CD8-positive TILs count and biomarkers
Figure 3 The numbers of CD8-positive TILs within cancer cell nest were significantly lower in cases with low PD-L1 expression (A; P=0.010) and high-Cox-2 expression (B; P=0.020). Differences were tested using the Mann–Whitney U-test.
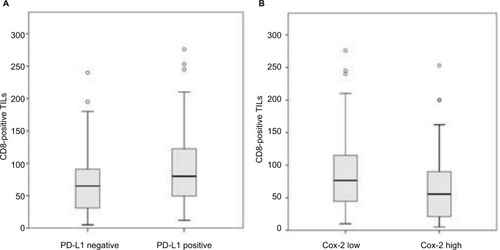
Table 2 Relationship of PD-L1 and Cox-2 expression and clinicopathological factors
Table 3 Relationship of tumor immune microenvironment and clinicopathological factors
Figure 4 Comparison of recurrence-free survival rates between patients with high CD8-positive TILs counts versus those with low CD8-positive TILs counts (A), high PD-L1 expressions versus low PD-L1 expressions (B), and tumor microenvironment type IV versus type I versus type II versus type III (C). P=0.038, 0.006, and 0.002, respectively.
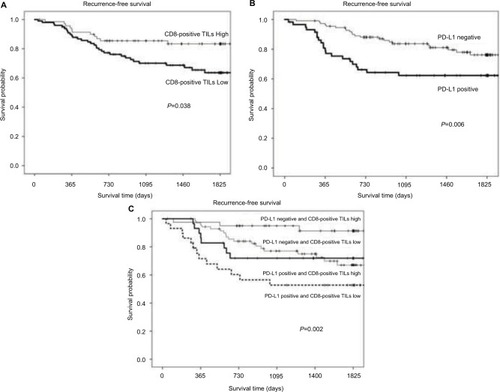
Figure 5 Comparisons of recurrence-free survival rates between patients with high Cox-2 expression versus low Cox-2 expression, according to tumor microenvironment status: type I (A), type II (B), type III (C), and type IV (D). P=0.616, 0.021, 0.842, and 0.208, respectively.
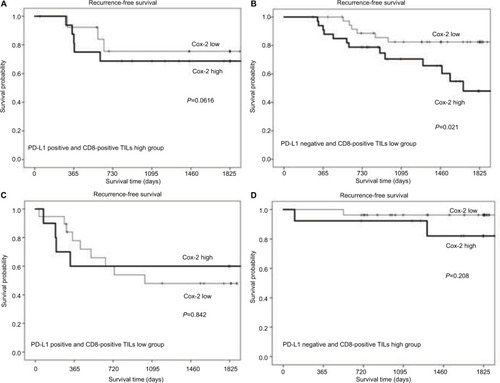
Table 4 Results of the univariate and multivariate cox regression analyses of recurrence-free survival