Figures & data
Table 1 Clinicopathologic variables in 83 gastric cancer patients
Figure 1 GATA3 is downregulated in gastric cancer tissues.
Notes: (A) Total mRNA was extracted from 83 pairs of tumor tissue samples and adjacent normal tissue samples. qRT-PCR was performed to determine the relative mRNA level of GATA3. *P<0.05, expression of GATA3 in tumor samples vs. adjacent normal samples. (B) Whole protein was lysed from 83 pairs of tumor tissue samples and adjacent normal tissue samples. Western blotting was performed to determine the relative protein level of GATA3. The immunoblot shown is a representative image. (C) Survival curve was analyzed by Kaplan–Meier method.
Abbreviation: qRT-PCR, quantitative real time polymerase chain reaction.
Abbreviation: qRT-PCR, quantitative real time polymerase chain reaction.
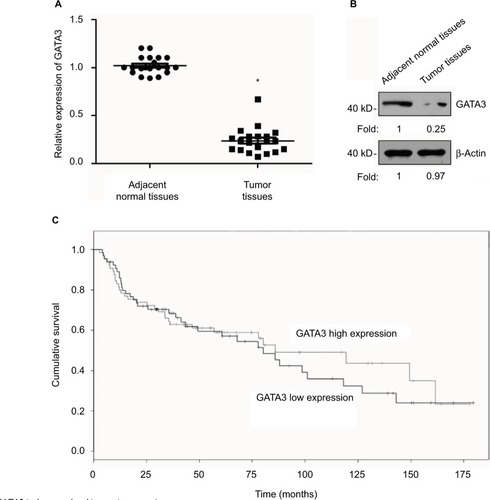
Figure 2 GATA3 is downregulated in GC cells.
Notes: (A) Expression of GATA3 in GC cell lines, CTC-141 and MKN45, and human normal gastric mucosal cell line GES-1 was detected by qRT-PCR and Western blotting, respectively. *P<0.05, expression of GATA3 in CTC-141 or MKN45 vs. GES-1. (B) GATA3 was overexpressed or knocked down in CTC-141 cells. After transfection for 48 h, the expression of GATA3 was determined by qRT-PCR and Western blotting. *P<0.05, **P<0.01, GATA3 vs. vector, and siGATA3 vs. SCR. (C) GATA3 was overexpressed or knocked down in MKN45 cells. After transfection for 48 h, the expression of GATA3 was determined by qRT-PCR and Western blotting. *P<0.05, **P<0.01, GATA3 vs. vector, and siGATA3 vs. SCR.
Abbreviations: GC, gastric cancer; SCR, scramble siRNA; qRT-PCR, quantitative real time polymerase chain reaction.
Abbreviations: GC, gastric cancer; SCR, scramble siRNA; qRT-PCR, quantitative real time polymerase chain reaction.
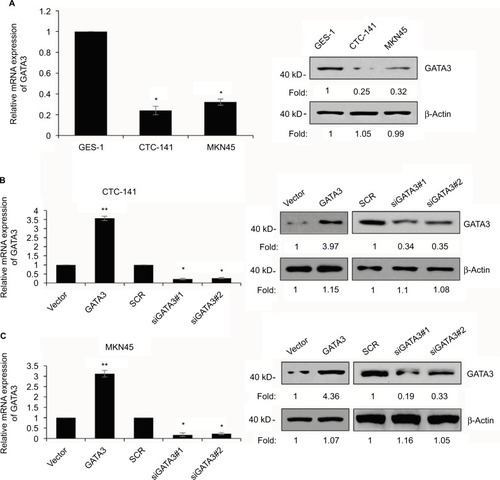
Figure 3 Restoration of GATA3 levels inhibits the proliferation of gastric carcinoma cells.
Notes: (A) GATA3 was overexpressed or knocked down in CTC-141 and MKN45 cells/well. Then, 3,000 cells were placed in 96-well plates, and CCK-8 assay was performed to detect the effect of GATA3 on cell proliferation. *P<0.05, GATA3 vs. vector, and siGATA3 vs. SCR. (B) GATA3 was overexpressed or knocked down in CTC-141 and MKN45 cells. Then, 5,000 cells/well were placed in six-well plates, and colony formation assay was performed to detect the effect of GATA3 on cell proliferation. *P<0.05, GATA3 vs. vector, and siGATA3 vs. SCR. (C) GATA3 was overexpressed or knocked down in CTC-141 and MKN45 cells. Then, 2×10⁴ cells were counted, and cell cycle profile was determined by FACScan flow cytometry. The percentage of cells in different cell cycle phases is shown.
Abbreviations: CCK-8, Cell Counting Kit-8; SCR, scramble siRNA.
Abbreviations: CCK-8, Cell Counting Kit-8; SCR, scramble siRNA.
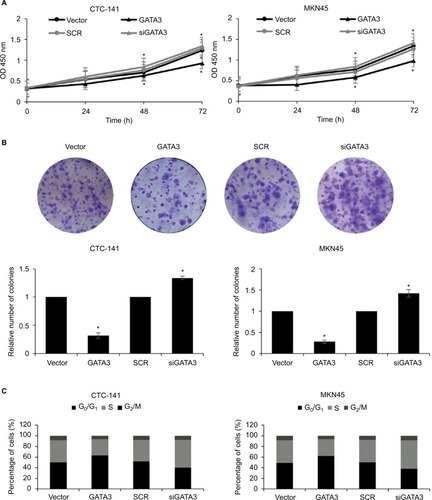
Figure 4 Restoration of GATA3 levels inhibits the migratory and invasive behavior of gastric cancer cells.
Notes: (A) GATA3 was overexpressed or knocked down in CTC-141 cells. Transwell migration assay was used to detect the effect of GATA3 on cell migration. *P<0.05, GATA3 vs. vector, and siGATA3 vs. SCR. (B) GATA3 was overexpressed or knocked down in CTC-141 cells. Transwell invasion assay was used to detect the effect of GATA3 on cell invasion. *P<0.05, GATA3 vs. vector, and siGATA3 vs. SCR.
Abbreviation: SCR, scramble siRNA.
Abbreviation: SCR, scramble siRNA.
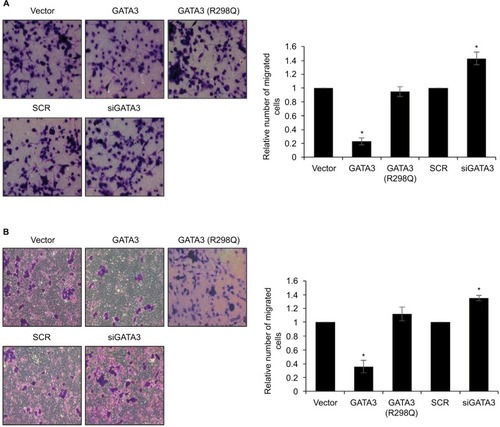
Figure 5 GATA3 inhibits epithelial–mesenchymal transition (EMT) in gastric cancer cells.
Notes: (A) CTC-141 cells were transfected with vector, GATA3 and GATA3 (R298Q), and the relative expressions of EMT-associated genes were detected by qRT-PCR. *P<0.05, GATA3 or GATA3 (R298Q) vs. vector. (B) CTC-141 cells were transfected with vector, GATA3 and GATA3 (R298Q), and the protein levels of EMT-associated proteins were detected by Western blotting. (C) CTC-141 cells were transfected with SCR and siGATA3, and the relative expressions of EMT-associated genes were detected by qRT-PCR. *P<0.05, siGATA3 vs. SCR. (D) CTC-141 cells were transfected with SCR and siGATA3, and the protein levels of EMT-associated proteins were detected by Western blotting.
Abbreviations: SCR, scramble siRNA; qRT-PCR, quantitative real time polymerase chain reaction.
Abbreviations: SCR, scramble siRNA; qRT-PCR, quantitative real time polymerase chain reaction.
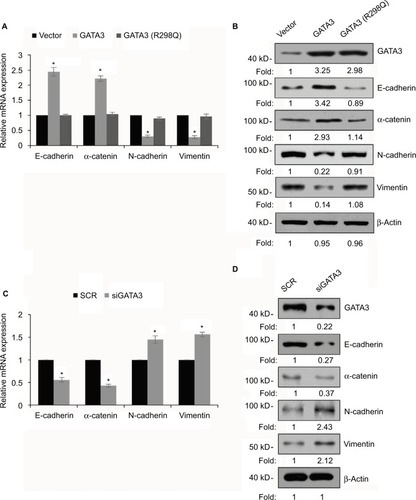
Figure 6 GATA3 transcriptionally regulates ZEB1 in G cells.
Notes: (A) CTC-141 cells were transfected with vector, GATA3 and GATA3 (R298Q), and the relative expressions of EMT-associated transcription factors were detected by qRT-PCR. **P<0.01, GATA3 or GATA3 (R298Q) vs. vector. (B) CTC-141 cells were transfected with vector, GATA3 and GATA3 (R298Q), and the protein levels of epithelial–mesenchymal transition-associated transcription factors were detected by Western blotting. (C) ChIP and qChIP assay was performed to determine whether GATA3 bounded with the promoter region of slug, snail and ZEB1. **P<0.01, GATA3 vs. IgG. (D) Luciferase reporter assay was performed to determine whether GATA3 transcriptionally regulated ZEB1. *P<0.05, **P<0.01, GATA3 or GATA3 (R298Q) vs. vector.
Abbreviations: qRT-PCR, quantitative real time polymerase chain reaction; ChIP, chromatin immunoprecipitation; qChIP, quantitative chromatin immunoprecipitation.
Abbreviations: qRT-PCR, quantitative real time polymerase chain reaction; ChIP, chromatin immunoprecipitation; qChIP, quantitative chromatin immunoprecipitation.
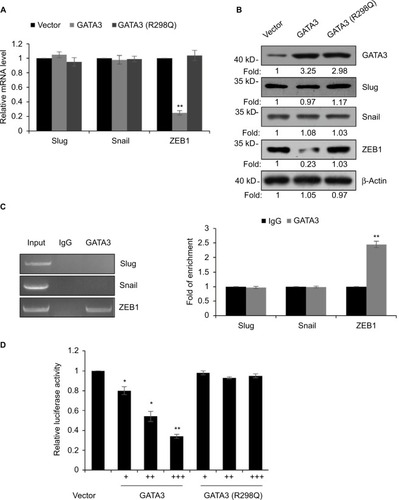
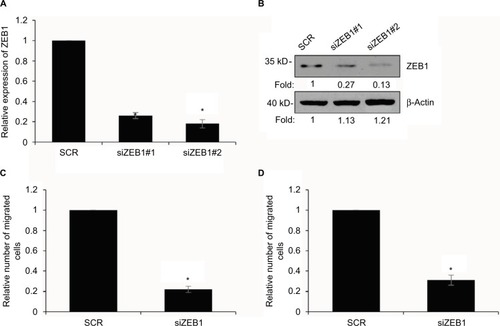
Figure 7 Overexpression of ZEB1 suppresses the migratory and invasive behavior of gastric cancer cells.
Notes: (A) ZEB1 was knocked down in CTC-141 cells. After transfection for 48 h, the expression of ZEB1 was determined by qRT-PCR. *P<0.05, siZEB1 vs. SCR. (B) ZEB1 was knocked down in CTC-141 cells. After transfection for 48 h, the expression of ZEB1 was determined by Western blotting. (C) ZEB1 was knocked down in CTC-141 cells. Transwell migration assay was used to detect the effect of ZEB1 on cell migration. *P<0.05, siZEB1 vs. SCR. (D) ZEB1 was knocked down in CTC-141 cells. Transwell invasion assay was used to detect the effect of ZEB1 on cell invasion. *P<0.05, siZEB1 vs. SCR.
Abbreviations: SCR, scramble siRNA; qRT-PCR, quantitative real time polymerase chain reaction.
Abbreviations: SCR, scramble siRNA; qRT-PCR, quantitative real time polymerase chain reaction.