
Figures & data
Figure 1 Age distribution of breast cancer incidence among women from Soweto, Johannesburg, and among US SEER Black and White women adjusted for Johannesburg population structure 2009–2011.
Abbreviation: SEER, Surveillance, Epidemiology, and End Results.
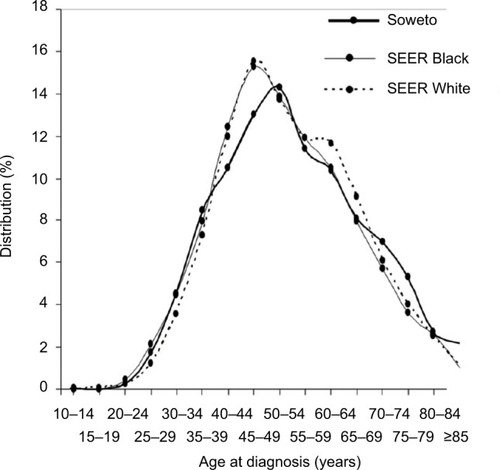
Table 1 Demographic and clinical characteristics of patients by chemotherapy category
Table 2 Multivariable logistic regression model of predictors of neoadjuvant versus adjuvant chemotherapy