
Figures & data
Figure 1 The changes in the circRNA expression profile in breast cancer.
Notes: Differentially expressed circRNAs were selected by false discovery rate ≤0.001 and fold change ≥2 or fold change ≤0.5 and that 152 circRNAs were differentially expressed between breast cancer tissues and the corresponding adjacent non-cancerous tissues. Eighty-five circRNAs were upregulated and 67 were downregulated using high-throughput RNA sequencing technology (A). A KEGG pathway analysis was performed to determine the correlation between differentially expressed circRNA and pathways in breast cancer (B).
Abbreviations: DEG, differentially expressed gene; CR, cancer tissue; KEGG, Kyoto encyclopedia of genes and genomes; MAPK, mitogen activated protein kinase; NOD, nucleotide oligomerization domain; PR, paraneplastic normal tissue; TGF, transforming growth factor; TNF, tumor necrosis factor; TPM, transcripts per Kilobase Million.
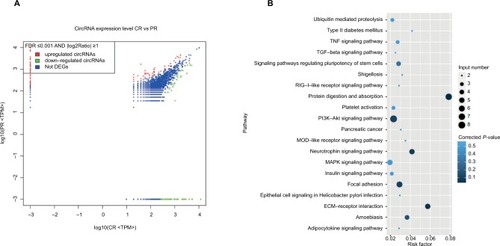
Figure 2 Three circRNAs (hsa_circ_0093859, hsa_circ_0007534, and hsa_circ_0011946) were up-regulated in both cells and breast tissues.
Notes: The circRNA-miRNA-mRNA networks were predicted based on online databases (A), the sexangle denotes miRNA, the inverted triangle represents circRNA, the rhombus is mRNA, and their relationship is depicted by the linear connections. Divergent primers were used to amplify circRNAs in cDNA but not gDNA (B). Sanger sequencing was performed to confirm the head-to-tail back-spliced site (red arrow) (C). The levels of hsa_circ_0093859, hsa_circ_0007534, and hsa_circ_0011946 expression were carried out using RT-qPCR among 6 different breast cancer cell lines (HS-578T, T47D, MCF-7, BT549, MDA-MB-231, and SKBR-3) (D) and 12 pairs of breast cancer tissues (E).
Abbreviations: cDNA, complementary DNA, gDNA, genome DNA; RFC, replication factor C; RFC3, RFC subunit 3; RT-qPCR, reverse transcription-quantitative polymerase chain reaction.
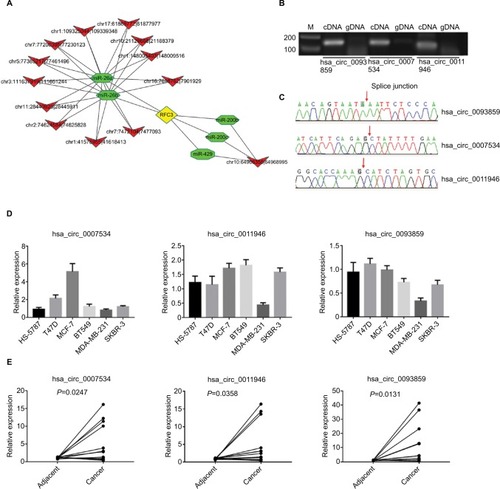
Figure 3 Downregulated hsa_circ_0011946 inhibited RFC3 expression in MCF-7 cells.
Notes: After transfection with si-hsa_circ_0011946 for 48 h, the expression levels of hsa_circ_0011946 and RFC3 were assessed with a RT-qPCR assay (A). The protein expression of RFC3 was measured by Western blotting (B). n=3 in each group. *P<0.05, **P<0.001 compared with the NC group.
Abbreviations: GAPDH, glyceraldehyde-3-phosphate dehydrogenase; NC, negative control; RFC, replication factor C; RFC3, RFC subunit 3; RT-qPCR, reverse transcription-quantitative polymerase chain reaction.
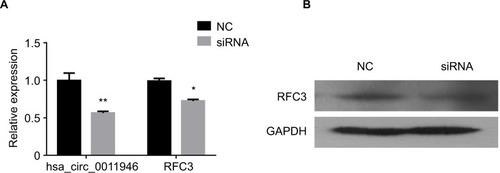
Figure 4 The downregulation of hsa_circ_0011946 inhibited the migration and invasion of MCF-7 cells.
Notes: Cell proliferation was monitored using an MTT assay after transfection with si-hsa_circ_0011946 for 24, 48, and 72 h (A). After transfection with si-hsa_circ_0011946 for 48 h, MCF-7 cells showed reduced migration and invasion abilities (B). n=3 in each group. *P<0.05, **P<0.001 compared with the NC group.
Abbreviations: MTT, 3-(4, 5-dimethylthiazol-2-yl)-2, 5-diphenyltetrazolium bromide; NC, negative control; OD, optical density.
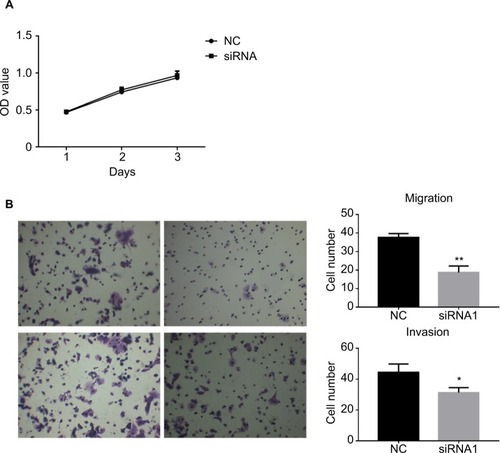
Table S1 Clinical characteristics of the study population