
Figures & data
Figure 1 Flow chart of the patients.
Abbreviations: CR, complete remission; HSCT, hematopoietic stem cell transplantation.
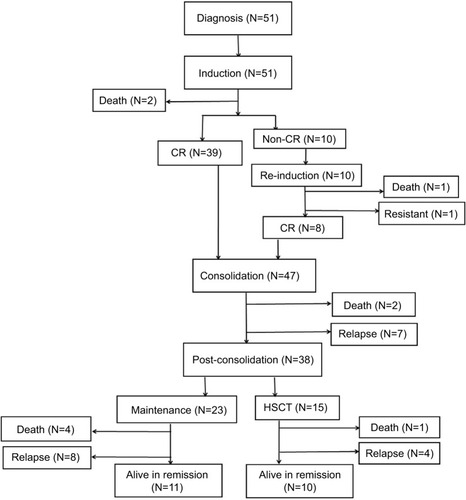
Table 1 Patient characteristics in adult B-ALL cohorts
Figure 2 Kaplan–Meier estimates of EFS and OS in adult patients with B cell acute lymphoblastic leukemia.
Notes: Patients with a WBC-15 <0.40×10⁹/L vs. patients with a WBC-15 ≥0.40×10⁹/L. (A) The 2-year EFS was 52.0%±13.9% (N=26, 95% CI: 23.3%–74.5%) vs. 4.3%±4.2% (N=25, 95% CI: 0.3%–18.2%), respectively, P=0.0020. (B) The 3-year OS was 66.4%±10.8% (N=26, 95% CI: 41.1%–82.8%) vs. 11.2%±7.1% (N=25, 95% CI: 2.1%–29.0%), respectively, P=0.0111. P-values were based on the log-rank test. WBC-15 indicates WBC count on day 15 during induction therapy.
Abbreviations: EFS, event-free survival; OS, overall survival; WBC, white blood cell.
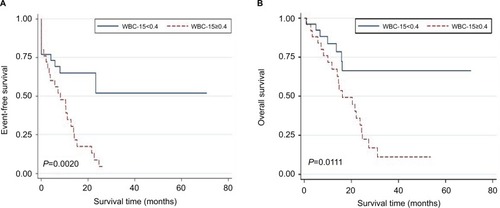
Table 2 Univariate analysis for event-free and overall survival
Table 3 Multivariate analysis for event-free and overall survival
Table S1 Treatment and follow-up of the 51 adult B-ALL patients