Figures & data
Figure 1 Flow diagram of the study selection process.
Abbreviation: CRPC, castration-resistant prostate cancer.
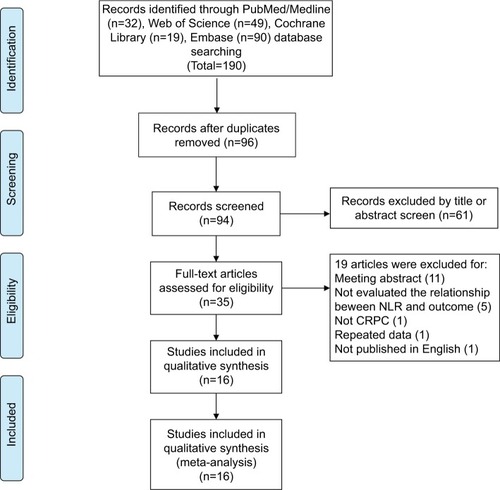
Table 1 Main characteristics of the included studies
Table 2 NLR pooled HRs and 95% CIs in meta-analysis for OS and PFS
Figure 2 Forest plot HR for the correlation between neutrophil–lymphocyte ratio and overall survival (A) and progression-free survival (B) in castration-resistant prostate cancer patients.
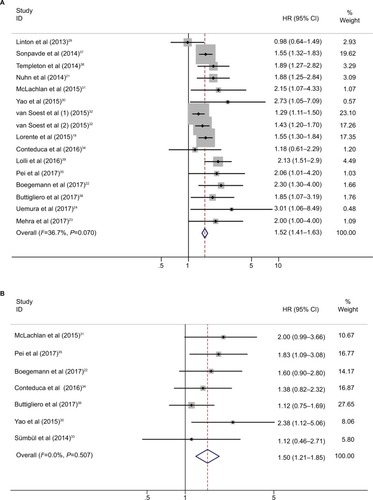
Figure 3 Subgroup analysis of pooled overall survival based on a neutrophil–lymphocyte ratio cutoff value (A), nation (B), treatment (C), and number of patients (D).
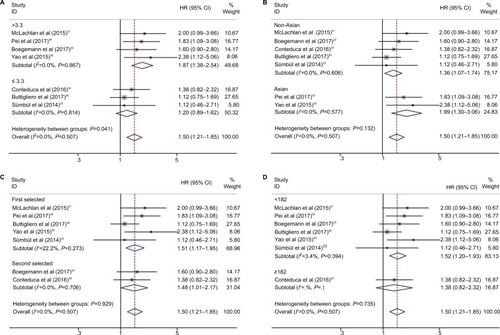
Figure 4 Subgroup analysis of pooled progression-free survival based on neutrophil–lymphocyte ratio cutoff value (A), nation (B), treatment (C), and number of patients (D).
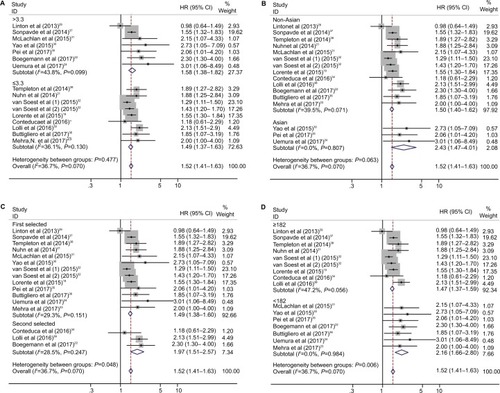
Figure 5 Funnel plots based on overall survival (A) and progression-free survival (B) (Begg’s test).
Abbreviation: SE, standard error.
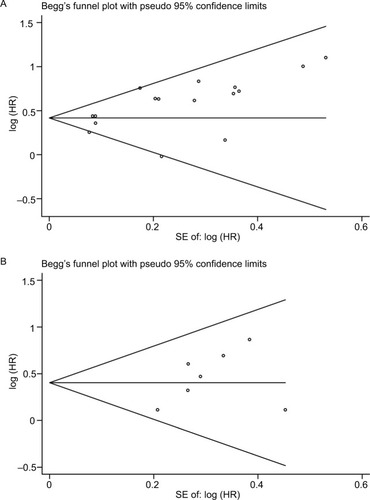
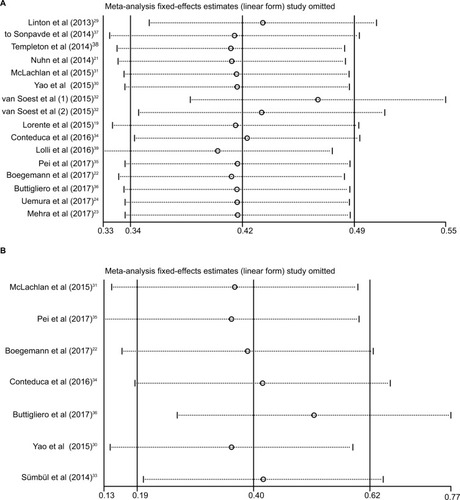
Figure 6 Sensitivity analysis for overall survival (A) and progression-free survival (B) in this meta-analysis.