Figures & data
Figure 1 EBV infection promotes xenograft growth and tumor-associated angiogenesis in vivo.
Notes: (A) The scheme for establishing an EBV-positive/EBV-negative xenograft-bearing mouse model is illustrated. (B) The EGFP-encoding sequence was simultaneously introduced into CNE2 and HK1 cells with the infectious rEBV, which served as a visible indicator for the EBV-positive cells. The red square boxes denote the EGFP-labeled EBV-positive cells that were captured after the co-cultivated EBV infection. Scale bar =50 μm; 200× magnification. (C) After antibiotic resistance-based cell selection, clonal populations of cells were selected by transferring a well-isolated single clump of cells. EBV-encoded LMP1 was detected by western blotting in mock-controlled and EBV-infected CNE2 and HK1 cells. The selected EBV-positive CNE2 and HK1 cells were used for subsequent experiments. (D) Representative photographs of the female BALB/c(nu/nu) mice harboring both EBV-positive (left) and EBV-negative (right) xenografts were captured on Day 30 postinoculation. The dissected xenografts are shown in each bottom panel. Scale bar =10 mm. (E) The xenograft volumes were measured every 5 days from Day 10 postinoculation, when palpable xenografts could be observed (n=5). (F) The EBV-positive and EBV-negative xenografts were isolated from the sacrificed mice on Day 30 and weighed. (G) The representative immunohistochemical analysis of CD31 in the paraffin-embedded xenograft sections. (H) Tumor-associated angiogenesis was quantitatively evaluated by determining the vessel numbers per field. Scale bar =100 μm; 400× magnification. The data are presented as the mean ± SEM (*P<0.05, paired t-test).
Abbreviations: EBV, Epstein–Barr virus; EGFP, enhanced green fluorescent protein; LMP1, latent membrane protein 1; rEBV, recombinant EBV.
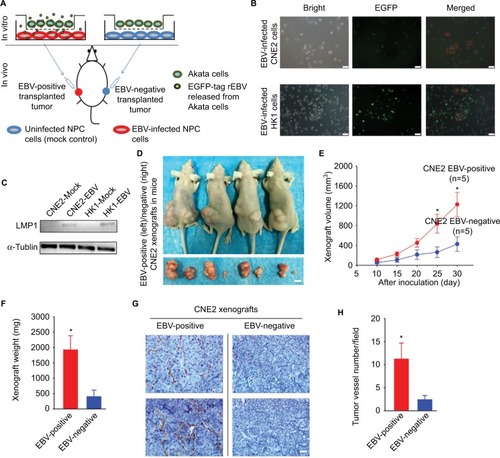
Figure 2 EBV infection promotes EGF-stimulated VEGF production and endothelial tube formation.
Notes: (A) VEGF-A production was determined in the mock-controlled and the EBV-infected CNE2 or HK1 cell-conditioned medium. The amount of VEGF released from the serum-starved cells in the absence or presence of extracellular EGF stimulation was determined by ELISA. (B) HUVECs were incubated with the cell-conditioned medium as indicated. Representative photographs of HUVEC tube formation were captured at 6 hours after cell seeding; scale bar =100 μm. The tube formation was quantitatively evaluated by calculating the tube length per standard area in each well (right panel). The data are representative of three independent experiments and are presented as the mean ± SEM (*P<0.05, Student’s t-test).
Abbreviations: EBV, Epstein–Barr virus; EGF, epidermal growth factor; ELISA, enzyme-linked immunosorbent assay; HUVECs, human umbilical vein endothelial cells.
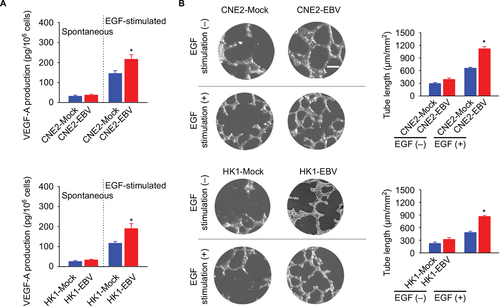
Figure 3 EBV infection amplifies EGF-stimulated Ca2+ signaling via SOCE.
Notes: (A) EGF-evoked Ca2+ transient responses were measured in the fura-2-loaded cells. The dynamic cytosolic Ca2+ level [Ca2+]cyt was measured as the fluorescence ratio (F340/F380) of fura-2. Each trace represents the average data from at least 20 individual cells. The intensities of Ca2+ responses were quantitatively evaluated by calculating the average peak from the baseline in each right panel. (B) EGF-induced Ca2+ release from intracellular Ca2+ stores (ER) and the following Ca2+ influx via membrane channels were measured in the absence and presence of extracellular Ca2+, successively. The data are representative of three independent experiments and are presented as the mean ± SEM (*P<0.05, Student’s t-test).
Abbreviations: EBV, Epstein–Barr virus; EGF, epidermal growth factor; ER, endoplasmic reticulum.
![Figure 3 EBV infection amplifies EGF-stimulated Ca2+ signaling via SOCE.Notes: (A) EGF-evoked Ca2+ transient responses were measured in the fura-2-loaded cells. The dynamic cytosolic Ca2+ level [Ca2+]cyt was measured as the fluorescence ratio (F340/F380) of fura-2. Each trace represents the average data from at least 20 individual cells. The intensities of Ca2+ responses were quantitatively evaluated by calculating the average peak from the baseline in each right panel. (B) EGF-induced Ca2+ release from intracellular Ca2+ stores (ER) and the following Ca2+ influx via membrane channels were measured in the absence and presence of extracellular Ca2+, successively. The data are representative of three independent experiments and are presented as the mean ± SEM (*P<0.05, Student’s t-test).Abbreviations: EBV, Epstein–Barr virus; EGF, epidermal growth factor; ER, endoplasmic reticulum.](/cms/asset/5308349b-8da4-43d6-afa0-3a2d94c815fd/dcmr_a_12185402_f0003_c.jpg)
Figure 4 2-APB blunts EBV-promoted endothelial tube formation mediated by VEGF.
Notes: (A) Effects of 2-APB at increasing concentrations on EGF-evoked Ca2+ responses are shown. (B) Effects of 2-APB at 20 μmol/L on EGF-induced Ca2+ release from the ER and the following SOCE were measured in the absence and presence of extracellular Ca2+, successively. (C) Effects of 2-APB at various concentrations on VEGF-A production upon EGF stimulation were determined by ELISA. (D) Effects of 2-APB on endothelial tube formation are shown; scale bar =100 μm. The data are representative of three independent experiments and are presented as the mean ± SEM (*P<0.05, Student’s t-test).
Abbreviations: 2-APB, 2-aminoethyl diphenylborinate; EBV, Epstein–Barr virus; EGF, epidermal growth factor; ELISA, enzyme-linked immunosorbent assay; ER, endoplasmic reticulum; SOCE, store-operated Ca2+ entry.
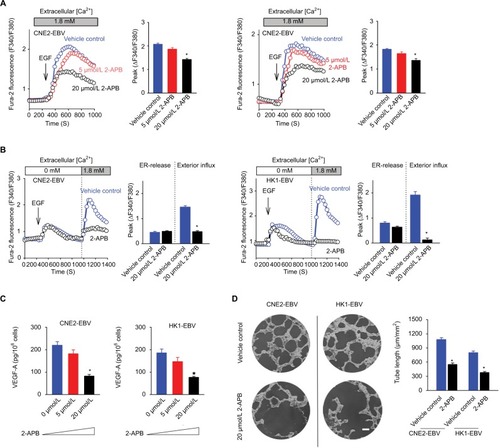
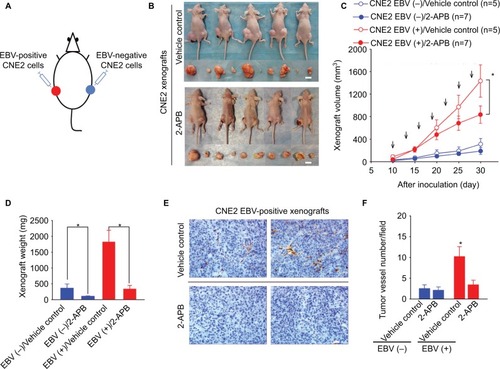
Figure 5 2-APB effectively blunts EBV-promoted xenograft growth and angiogenesis.
Notes: (A) The scheme for the xenograft model in mice. (B) Female BALB/c(nu/nu) mice harboring both EBV-positive and EBV-negative xenografts were treated with (a) PBS (vehicle control) or (b) 2-APB. Representative photographs of the xenograft-bearing mice were captured on Day 30 postinoculation. The xenografts isolated from each mouse are shown in the bottom panel. Scale bar =10 mm. (C) The xenograft volumes were measured every 5 days from Day 10 postinoculation. The mice were intraperitoneally injected every 3 days (arrows) with 2-APB (50 μg/kg; n=7) or control vehicle (PBS; n=5) from the 10th day postinoculation. (D) The weights of the xenografts were determined. (E) The representative immunohistochemical analysis of CD31 in the paraffin-embedded EBV-positive xenograft sections. Scale bar =100 μm; 400× magnification. (F) The tumor-associated angiogenesis was quantified as the vessel numbers per field (400× magnification). The data are presented as the mean ± SEM. (*P<0.05, Student’s t-test or paired t-test).
Abbreviations: 2-APB, 2-aminoethyl diphenylborinate; Ctrl, control; EBV, Epstein–Barr virus.