
Figures & data
Table 1 Clinicopathological characteristics of 5,047 non-metastatic colorectal cancer patients
Table 2 Distribution of stages in different age groups between male and female patients
Figure 1 Kaplan–Meier curves of DFS and OS in all patients and separate gender groups stratified by six consecutive age groups.
Note: DFS for all patients (A1), male patients (A2) and female patients (A3); OS for all patients (A2), male patients (B2) and female patients (C2).
Abbreviations: DFS, disease-free survival; OS, overall survival.
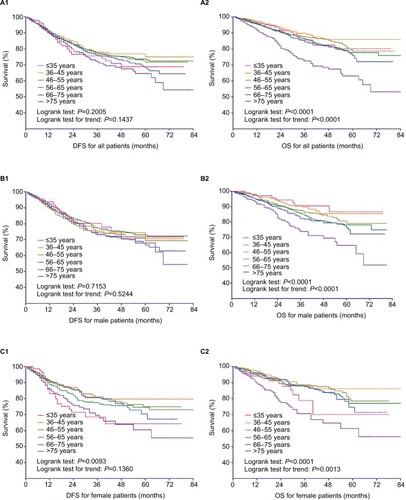
Figure 2 Kaplan–Meier curves of DFS and OS in male and female patients stratified by three different age groups.
Notes: DFS (A1) and OS (A2) for male patients; DFS (B1) and OS (B2) for female patients.
Abbreviations: DFS, disease-free survival; OS, overall survival.
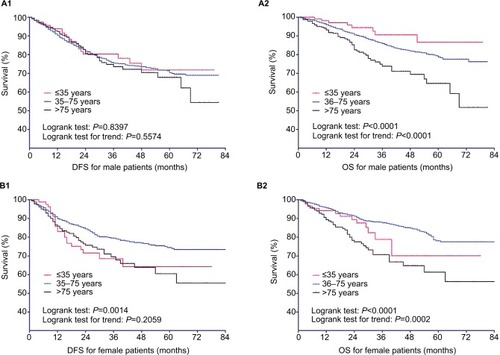
Figure 3 Kaplan–Meier curves of DFS and OS in three different age groups stratified by gender.
Notes: DFS in patients ≤35 (A1), 36–75 (B1) and >75 (C1) years old; DFS in patients ≤35 (A2), 36–75 (B2) and >75 years old (C2).
Abbreviations: DFS, disease-free survival; OS, overall survival; ref, reference.
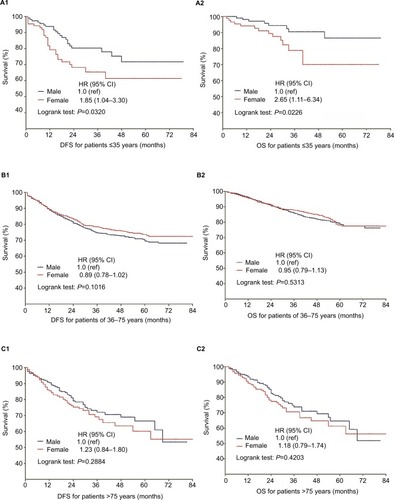
Figure 4 Forest plot for DFS based on multivariate COX model analyses of prognostic factors for both male and female colorectal cancer patients.
Abbreviation: DFS, disease-free survival.
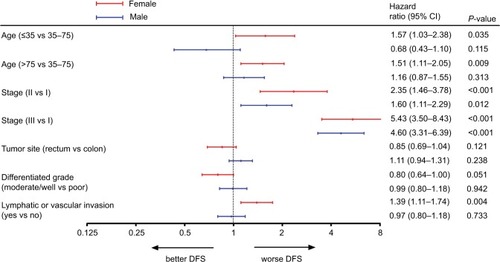
Table S1 Univariate analyses of prognostic factors for DFS and OS based on Cox proportional hazard model between male and female CRC patients
Table S2 Multivariate analyses of prognostic factors for DFS and OS based on Cox proportional hazard model between male and female CRC patients