
Figures & data
Figure 1 Flow chart of meta-analysis literature search.
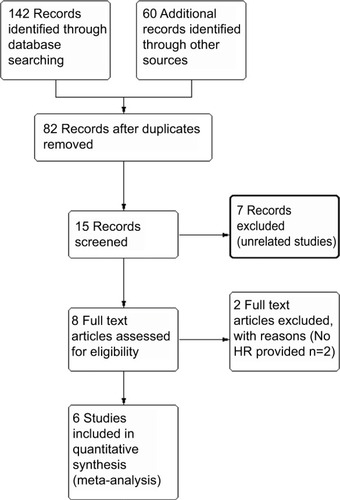
Table 1 The characteristics of the included studies
Figure 2 Meta-analysis plots.
Notes: Forest plot of HR for the association of high plasma INHBA level and survival (A). Begg’s funnel plots of publication bias (B).
Abbreviation: UTC, upper tract urothelial carcinoma.
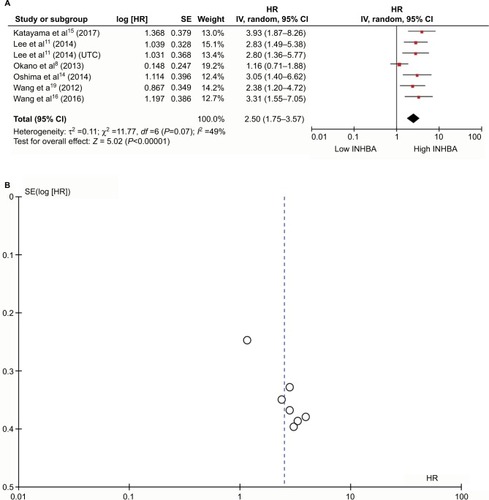
Table 2 INHBA expression and other important clinicopathological parameters in esophageal squamous cell carcinoma
Figure 3 INHBA expression determined by IHC.
Notes: Normal esophageal tissue demonstrated no expression of INHBA protein in the cytoplasm of esophageal squamous cells (magnification: A, ×40; B, ×200). Low expression level of INHBA in ESCC tissues (magnification: C, ×40; D, ×200). Median expression of INHBA in ESCC tissues (magnification: E, ×40; F, ×200). High expression levels of INHBA were detected in ESCC tissues (magnification: G, ×40; H, ×200).
Abbreviations: ESCC, esophageal squamous cell carcinoma; IHC, immunohistochemistry.
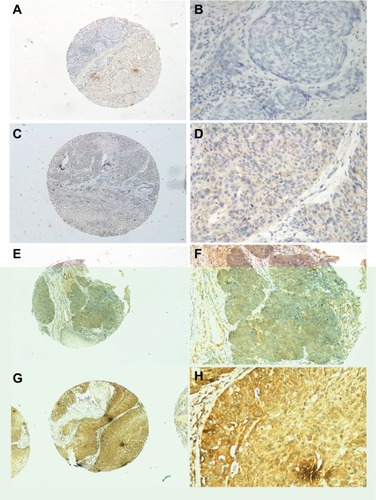
Figure 4 Disease-free survival (DFS) and overall survival (OS) curves according to patients’ INHBA expression.
Notes: DFS curve in all patients with different levels of INHBA expression (A, P=0.001). OS curve in all patients with different levels of INHBA expression (B, P=0.001). DFS and OS curves in patients in TNM stage 1 and 2 with low and high INHBA expression (C, D, P=0.009 and P=0.008, respectively). DFS and OS curves in patients in N0 stage with low and high INHBA expression (E, F, P=0.022 and P=0.023, respectively).
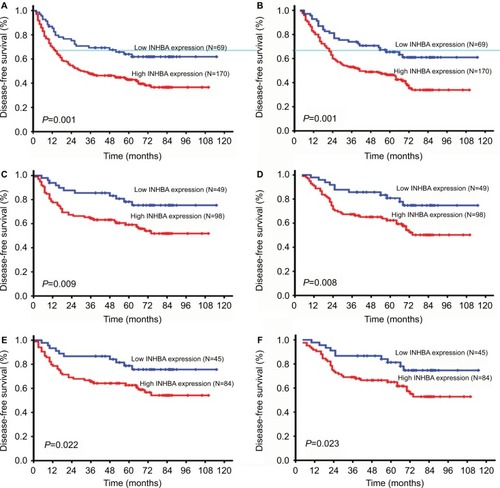
Table 3 Univariate Cox regression analysis in ESCC patients for disease-free survival and overall survival
Table 4 Multivariate Cox regression analysis for disease-free survival and overall survival in patients with esophageal squamous cell carcinoma
Figure S1 Sensitivity analysis.
Notes: Sensitivity test of the meta-analysis (A). “Trim and fill” method to adjust for publication bias in this meta study (B).
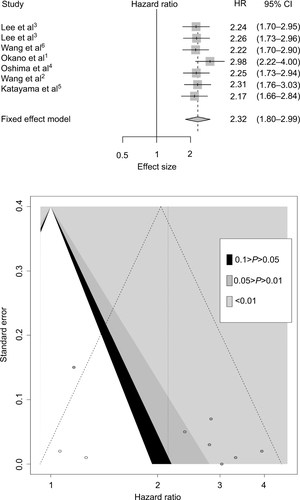
Table S1 Quality assessment of the selected papers