Figures & data
Table 1 List of primers used in this study
Figure 1 Doxorubicin affects Hela S3 cell apoptosis.
Notes: The HeLa S3 cells were treated with Doxorubicin (0, 100, 300, 600, 900 and 1200 μM) for 24 hours. (A) The percentage of apoptosis cells is shown. (B) Bars represent mean of three independent experiments performed in triplicate.
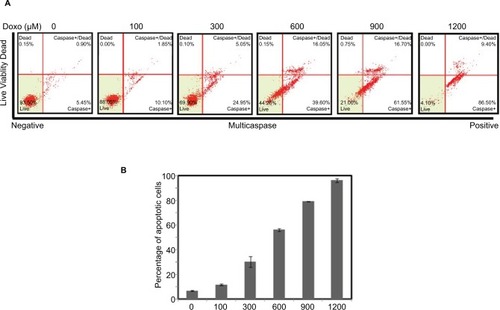
Figure 2 Effects of different concentrations of Doxorubicin on the mRNA expression of Notch pathway members.
Notes: (A) HeLa S3 cells were treated with Doxorubicin (0, 300, 900 and 1200 μM) for 24 hours. The mRNA expression levels of Notch pathway components and targets were examined by real-time RT-PCR. (B) Selective representation of Doxorubicin-responsive Notch pathway genes. GAPDH was used as an internal control for the normalization of gene expression.
Abbreviation: RT-PCR, reverse transcriptase polymerase chain reaction.
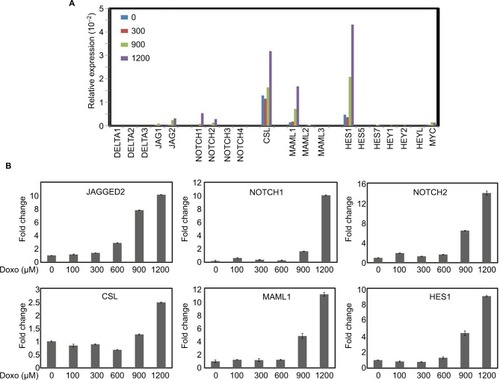
Figure 3 Upregulation of HES1 expression could promote Doxorubicin-induced apoptosis.
Notes: Cells were stably transfected with HES1 overexpression plasmids. Cells transfected with empty pOZ vector were used as the control group. (A) The overexpression efficiency of HES1 was measured by real-time RT-PCR. (B) The levels of the overexpressed protein were detected by Western blot. (C) The cell viability of overexpressed cell line was detected by MTT. (D) The overexpressed cells were stained with Multicaspase/7-AAD for quantitative measurement by using flow cytometry. (E) Bars represent the mean of three independent experiments performed in triplicate of (D). #P>0.05, **P<0.01. The cells were treated with Doxorubicin (300 μM) for 24 hours.
Abbreviations: 7-AAD, 7-aminoactinomycin D; RT-PCR, reverse transcriptase polymerase chain reaction.
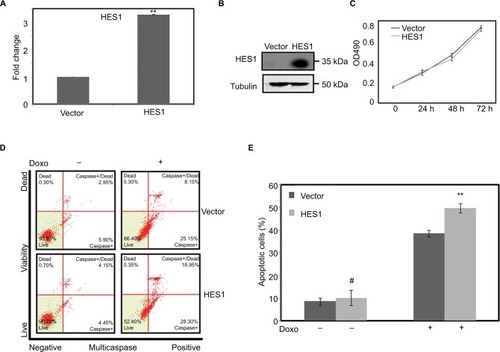
Figure 4 Downregulation of HES1 expression could inhibit Doxorubicin-induced apoptosis.
Notes: Cells were stably transfected with HES1 shRNA plasmids. Cells transfected with empty pLko.1 vector were used as the control group. (A) The knockdown efficiency of HES1 was measured by real-time RT-PCR. (B) The cell viability of knockdown cell lines was detected by MTT. (C) The knockdown and control cells were treated with Doxorubicin (300 μM) for 24 hours and then stained with Multicaspase/7-AAD for the quantitative measurement by using flow cytometry. (D) Bars represent the mean of three independent experiments performed in triplicate of (C). **P<0.01. #P>0.05.
Abbreviations: 7-AAD, 7-aminoactinomycin D; RT-PCR, reverse transcriptase polymerase chain reaction.
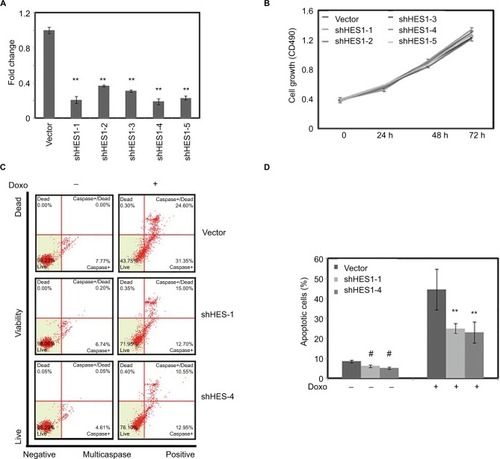
Figure 5 HES1 regulates apoptosis by activating PARP1.
Notes: HeLa cells were pretreated with PARP1 inhibitor Rucaparib (1 nM) for 7 days, and then, the cells were treated with Doxorubicin (300 μM) for 24 hours. (A) Cell apoptosis of HES1-knockdown cell lines was determined by flow cytometry. (B) Bars represent the mean of three independent experiments performed in triplicate of (A). (C) Cell apoptosis of HES1 overexpressing cell line was determined by flow cytometry. (D) Bars represent the mean of three independent experiments performed in triplicate of (C). **P<0.01, *P<0.05, #P>0.05.
Abbreviation: PARP1, poly(ADP-ribose) polymerase-1.
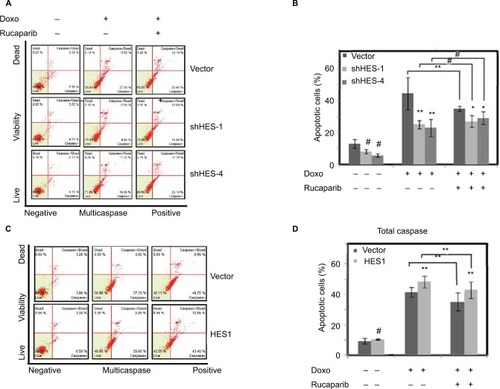
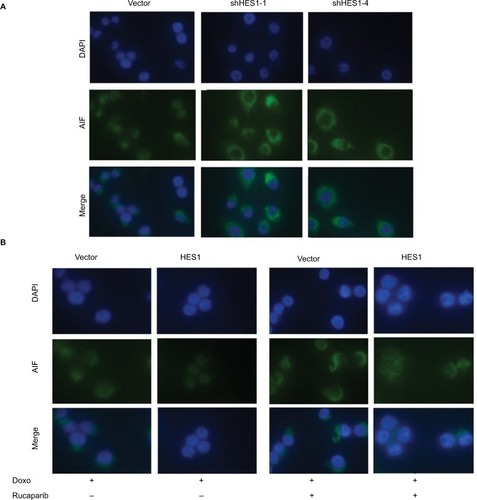
Figure 6 HES1 interplays with PARP1 to regulate AIF subcellular location.
Notes: HeLa cells were pretreated with PARP1 inhibitor Rucaparib (1 nM) for 7 days, and then, the cells were treated with Doxorubicin (300 μM) for 24 hours. (A) Immunofluorescence of AIF (green) in the HES1-knockdown and control cells. DAPI staining (blue) marks the nuclei. Merged images are also shown. (B) Immunofluorescence of AIF (green) in the HES1-overexpressing and control cells. The picture shows the location of AIF (green) in cells. DAPI staining (blue) marks the nuclei. Merged images are also shown.
Abbreviations: AIF, apoptosis-inducing factor; PARP1, poly(ADP-ribose) polymerase-1.