
Figures & data
Figure 1 Changes in CT in the ESCC.
Notes: (A and D) the well-circumscribed mass in right pleura (yellow arrows) and thickened esophageal wall (red arrow) prior to treatment, respectively. (B and E) Reduction in the lesions for the esophageal wall (red arrow) and stabilization of the lesion for the right pleura (yellow arrows) after two cycles of TP chemotherapy. (C and F) Esophageal wall (red arrow) thickness decrease and pleural lesion (yellow arrows) size stability after four cycles of TP chemotherapy.
Abbreviations: CT, computed tomography; ESCC, esophageal squamous cell carcinoma; TP, cisplatin–docetaxel.
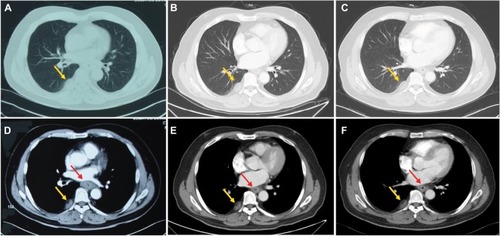
Figure 2 (A) Pathocytology of esophageal tissue revealed squamous cell carcinoma. (B and C) Pathocytology of pleural soft tissue showed a few of lymphocytes, erythropoiesis, megakaryocytes, and degraded cells.
Notes: (A and B) H&E staining ×100. Scale bar: 100 µm and (C) H&E staining ×200. Scale bar: 100 µm.
Abbreviation: H&E, hematoxylin and eosin.
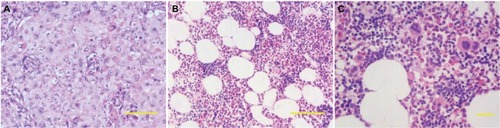
Figure 3 Immunohistochemical of pleural mass revealed EMH.
Notes: Immunohistochemical staining ×200. Scale bar: 200 µm. (A) CD15+; (B) CD20+; (C) CD34+; (D) CD30+; (E) CD38+; (F) CD68+; (G) CD7+; (H) Ki67+ (80–90%); (I) lysozyme+; (J) CK5−; and (K) CK7−.
Abbreviation: EMH, extramedullary hematopoiesis.
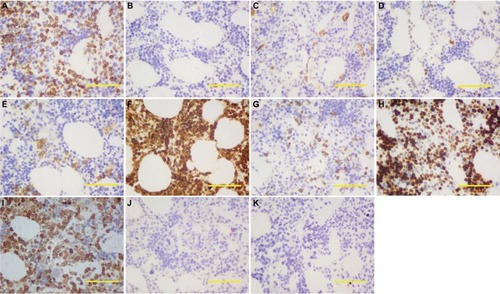
Figure 4 Variations in CT in the ESCC 1 month after finishing all the treatments.
Note: (A and B) The stabilization of the right pleural mass (yellow arrows) and decrease of the thickened esophageal wall (red arrow) after the treatment, respectively.
Abbreviations: CT, computed tomography; ESCC, esophageal squamous cell carcinoma.
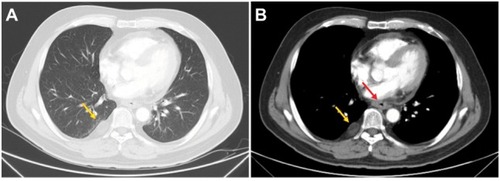
Figure 5 T2W/TSE sagittal MRI image 1 month after the completion of all the treatments, showing no considerable change in the size of the right pleural lesion (yellow arrow).
Abbreviations: MRI, magnetic resonance imaging; T2W/TSE, T2 weighted/turbo spin echo.
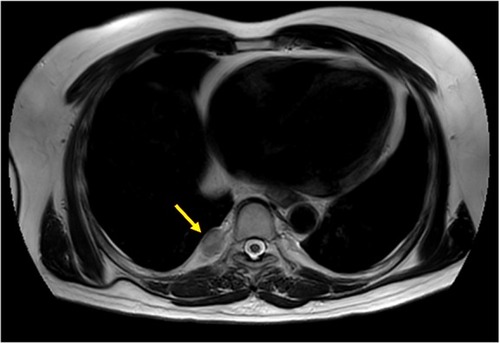
Table 1 Eligibility criteria for the literature review
Table 2 Summary of the malignant solid tumors
Table 3 Summary of the extramedullary hematopoiesis sites
Table 4 Summary of data collected from case reports included in the literature review
Figure 6 Process for the diagnosis and treatment of EMH in malignant solid tumors.
Abbreviations: CT, computed tomography; EMH, extramedullary hematopoiesis; MRI, magnetic resonance imaging.
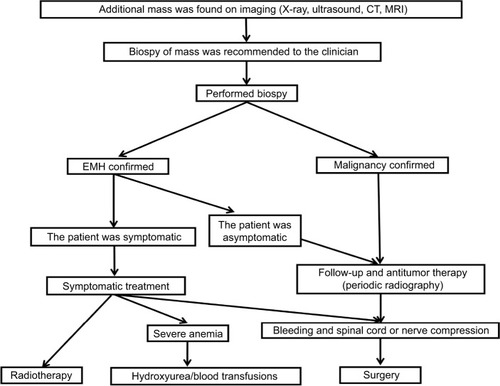
Table S1 Summary of the basic characteristics of patients