
Figures & data
Table 1 Correlation between miR-125a-5p expression and different clinical characteristics
Figure 1 miR-125a-5p expression was low in CRC tissues and cell lines. (A) The expression of miR-125a-5p in CRC tissues and matched ANTs. (B) qRT-PCR analysis of miR-125a-5p in CRC cell lines (HCT116, HCT8, HT29, SW620) and FHC. (C) Overall survival was compared between CRC patients showing low expression of miR-125a-5p and those showing high expression of miR-125a-5p. Each experiment was performed three times. Data are shown as mean±SD. *P<0.05, **P<0.01.
Abbreviations: CRC, colorectal cancer; ANT, adjacent normal tissue; qRT-PCR, quantitative real-time PCR.
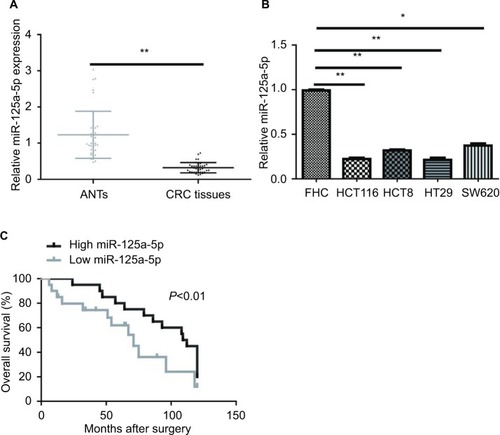
Table 2 Univariate and multivariate analyses for OS in patients with CRC
Figure 2 miR-125a-5p suppressed CRC cell proliferation, migration, invasion, and angiogenesis in vitro. (A) The expression of miR-125a-5p was upregulated in HCT116 and HT29 cells via transfecting with agomiR-125-5p. (B) CCK-8 assay was performed to assess the proliferation of HCT116 and HT29 after transfection with agomiR-125a-5p or negative control (agomiR-NC). (C, D) Wound healing and transwell assay were performed to detect the ability of migration and invasion of agomiR-125a-5p-transfected CRC cells or negative control. (E) HUVECs were cultured on Matrigel-coated plate with CM from CRC cells with agomiR-125a-5p or agomiR-NC transfection. Data are shown as mean±SD. *P<0.05, **P<0.01, ***P<0.001.
Abbreviations: CRC, colorectal cancer; CCK-8, cell counting kit-8; CM, conditioned medium; HUVEC, human umbilical vein endothelial cell.
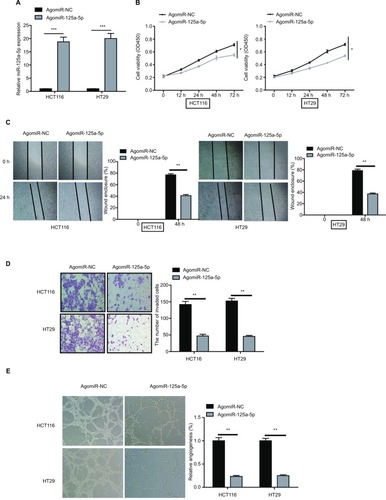
Figure 3 VEGFA is a target gene of miR-125a-5p. (A) Predicted miR-125a-5p target sequence in VEGFA 3′UTR is shown. (B) HCT116 and 293T cells were cotransfected with agomiR-125a-5p or agomiR-NC and WT or Mut-type VEGFA-3′UTR reporter plasmid. Luciferase activity was measured 48 h after transfection. (C, D) VEGFA mRNA and protein expression levels were measured in HCT116 and HT29 cells after transfection with agomiR-125a-5p or agomiR-NC by qRT-PCR and Western blot analysis, respectively. GAPDH was used as an internal control. Each experiment was performed three times. Data are shown as mean±SD. *P<0.05,***P<0.001.
Abbreviations: qRT-PCR, quantitative real-time PCR; UTR, untranslated region; WT, wild type; Mut, mutant.
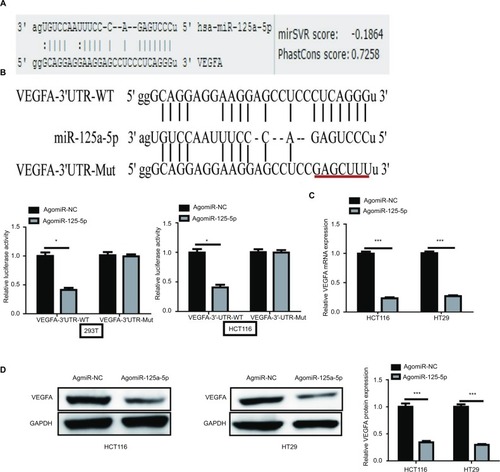
Figure 4 The expression of miR-125a-5p was negative compared with that of VEGFA in CRC tissues. (A) The expression of VEGFA mRNA in CRC tissues was markedly higher than that in ANTs. (B) IHC score of CRC tissues was higher than that in matched ANTs. (C) The statistical graph showed that IHC scores of VEGFA or VEGFA mRNA expression levels in high miR-125a-5p CRC tissues were significantly lower than those of low miR-125a-5p CRC tissues. (D) The correlation analyses were performed between VEGFA mRNA expression levels or IHC scores of VEGFA and the levels of miR-125a-5p expression in CRC tissues. Data are shown as mean±SD.*P<0.05, **P<0.01.
Abbreviations: CRC, colorectal cancer; ANT, adjacent normal tissue; IHC, immunohistochemistry.
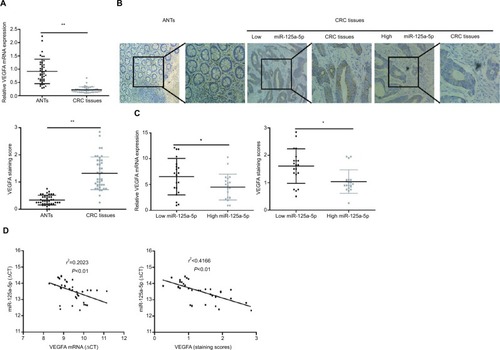
Figure 5 VEGFA overexpression could reverse the inhibitory effects of miR-125a-5p in CRC. (A) VEGFA protein expression in HCT116 and HT29 cells was measured after agomiR-125a-5p and VEGFA expression plasmid or blank (vector) transfection. (B–E) Cell proliferation, migration, invasion, and angiogenesis were measured in the HCT116 and HT29 cells transfected with agomiR-125a-5p and VEGFA expression plasmid or blank vector. *P<0.05, **P<0.01.
Abbreviation: CRC, colorectal cancer.
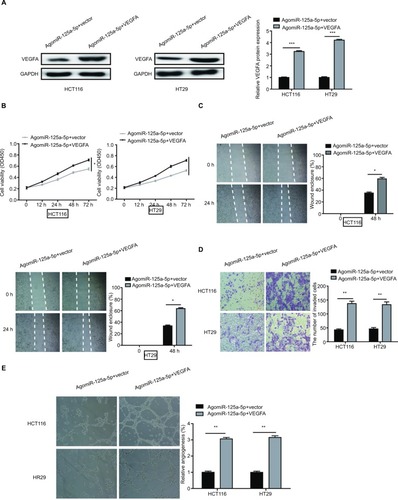
Figure 6 miR-125a-5p inhibited tumor growth and metastasis in vivo. (A) agomiR-125a-5p inhibited xenograft tumor growth. (B) miR-125a-5p inhibited CRC metastasis in vivo. Left, the gross lesion of lung tissues isolated from the nude mice; middle, the microscopic images of lung tissue sections stained by H&E; right, the number of metastatic nodules in the lungs 8 weeks after tail vein injection (five sections were evaluated per lung). Black arrows represent metastatic lung nodules. Data are shown as mean±SD. **P<0.01, ***P<0.001.
Abbreviation: CRC, colorectal cancer.
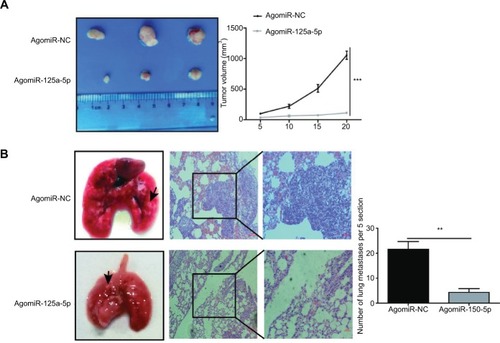
Figure 7 miR-125a-5p inhibited CRC progression via VEGFA/VEGFR2 signaling pathway. miR-125a-5p reduced the expression of VEGFA, p-VEGFR2, and p-Akt. GAPDH was used as an internal control. Each experiment was performed three times. Data are shown as mean±SD. **P<0.01.
Abbreviation: CRC, colorectal cancer.
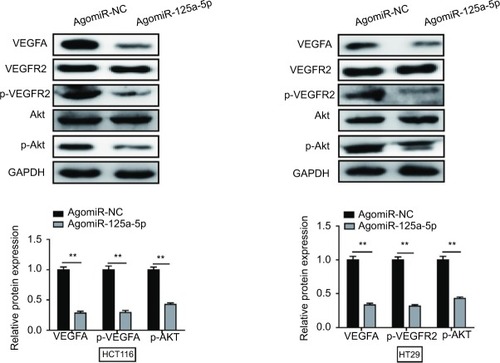
Figure S1 Inhibition of miR-125a-5p obviously increased the ability of CRC cell proliferation, migration, and invasion and HUVEC tube formation. (A) The expression of miR-125a-5p was downregulated in HCT116 cells via transfecting with antagomiR-125-5p. (B) CCK-8 assay was performed to assess the proliferation of HCT116 after transfection with antagomiR-125a-5p or negative control (antagomiR-NC). (C, D) Wound-healing and transwell assays were performed to detect the ability of migration and invasion of antagomiR-125a-5p-transfected CRC cells or negative control. (E) HUVECs were cultured on Matrigel-coated plate with CM from CRC cells transfected with antagomiR-125a-5p or antagomiR-NC. Each experiment was performed three times. Data are shown as mean±SD. *P<0.05, **P<0.01, ***P<0.001. Scale bars are 50 µm.
Abbreviations: CRC, colorectal cancer; CCK-8, cell counting kit-8; CM, conditioned medium; HUVEC, human umbilical vein endothelial cell.
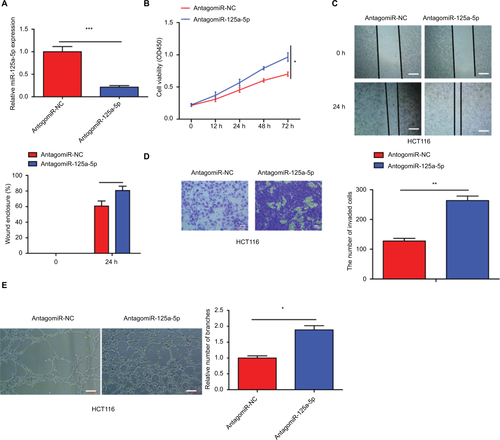
Figure S2 VEGFA downregulation inhibited the ability of CRC cell proliferation, migration, invasion, and HUVEC tube formation. (A) The expression of VEGFA was downregulated in HCT116 cells via transfecting with siVEGFA. (B–E) Cell proliferation, migration, invasion, and angiogenesis were measured in the HCT116 and HT29 cells transfected with agomiR-125a-5p and siVEGFA or scramble. Each experiment was performed three times. Data are shown as mean±SD. *P<0.05, **P<0.01, ***P<0.001. Scale bars are 50 µm.
Abbreviations: CRC, colorectal cancer; HUVEC, human umbilical vein endothelial cell; siVEGFA, small interference RNA against VEGF A.
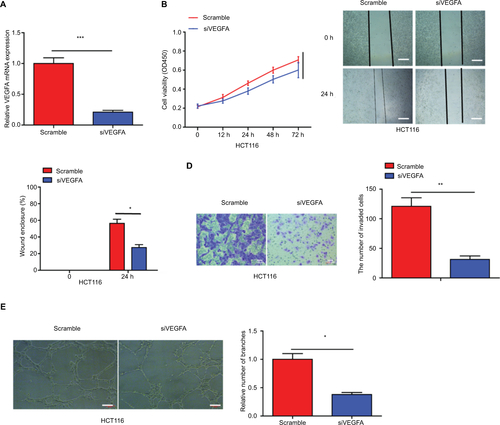
Table S1 The sequences of siZFAS1, siVEGFA-NC, antagomiR-125a-5p, antagomir-NC, agomiR-125a-5p, and antagomiR-125a-5p