
Figures & data
Table 1 Baseline characteristics of the HCC and control groups
Table 2 Joint-effects analysis between ALDH2 or CYP2E1 and drinking status on HCC susceptibility
Table 3 Joint-effects analysis between ALDH2 or CYP2E1 and drinking status on HCC susceptibility
Figure 1 Lymphocytes and ALDH2/CYP2E1 mRNA expression profiles. (A) Lymphocytes stained by the H&E method. (B) Curve of lymphocyte survival rate–culture time. (C) Curve of lymphocyte inhibitory rate–ethanol concentration. (D) Curves of lymphocyte inhibitory rate–culture time at different ethanol concentrations. (E and F) ALDH2, CYP2E1, and GAPDH mRNA expression levels at different ethanol concentrations.
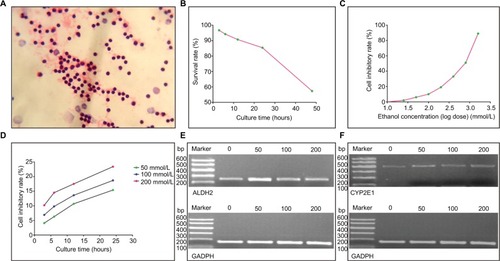
Figure 2 mRNA expression levels of ALDH2 and CYP2E1 in different groups. (A and B) ALDH2 mRNA expression levels in HCC and control groups. (C and D) CYP2E1 mRNA expression levels in HCC and control groups. (E and F) ALDH2 mRNA expression levels of the GG and GA+AA genotypes. (G and H) CYP2E1 mRNA expression levels of the C1/C1 and C1/C2+C2/C2 genotypes.
Note: * P<0.05; ** P<0.01; # P>0.05.
Abbreviation: HCC, hepatocellular carcinoma.
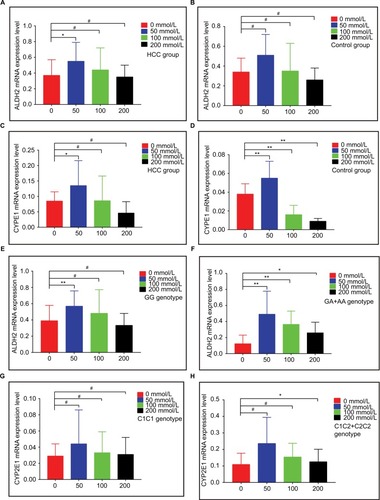
Table 4 Changes in ALDH2 and CYP2E1 mRNA expression levels after ethanol exposures
Figure 3 Expression levels of ALDH2 and CYP2E1 in different tissues. (A) ALDH2 expression levels in different tissues. (B) CYP2E1 expression levels in different tissues.
Figure 4 Gene expression levels and protein interactions. (A and B) ALDH2 and CYP2E1 gene expression levels in normal and primary tumor tissues. (C) Interactions of ALDH2 and CYP2E1 with other genes. (D) Interactions of ALDH2 and CYP2E1 with other proteins.
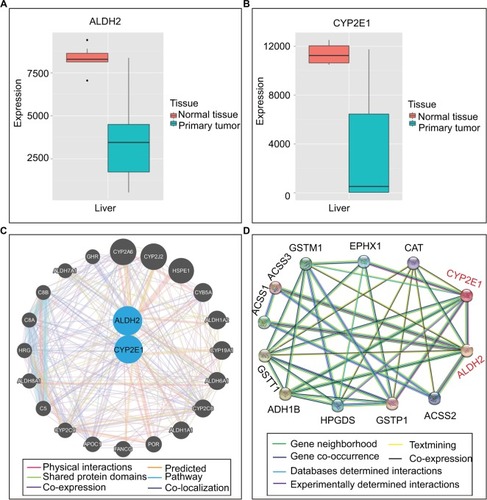
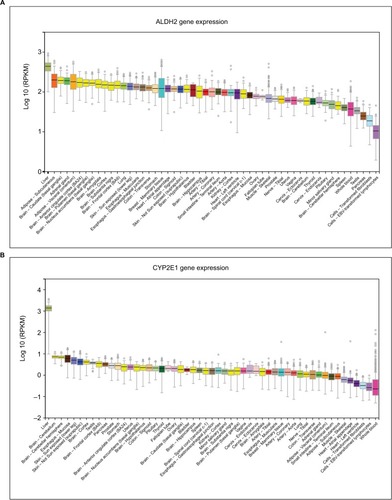
Figure 4 Gene expression levels and protein interactions. (A and B) ALDH2 and CYP2E1 gene expression levels in normal and primary tumor tissues. (C) Interactions of ALDH2 and CYP2E1 with other genes. (D) Interactions of ALDH2 and CYP2E1 with other proteins.
Table 5 Functional information of ALDH2 rs671 and CYP2E1 rs2031920 genetic polymorphisms