Figures & data
Table 1 Baseline characteristics of included studies
Figure 1 Flow diagram of study selection.
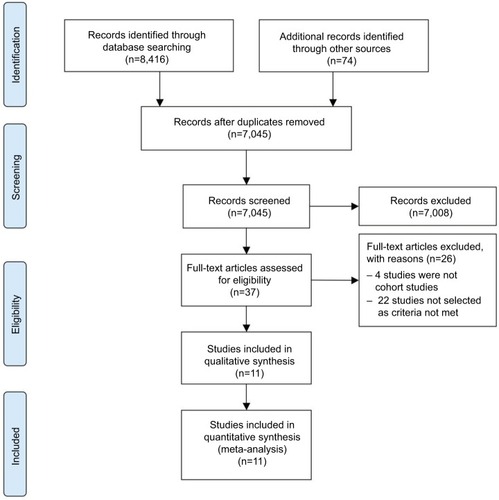
Figure 2 Forest plot for the overall estimate of the prevalence of thyroid cancer.
Abbreviations: ES, effect size; CI, confidence interval.
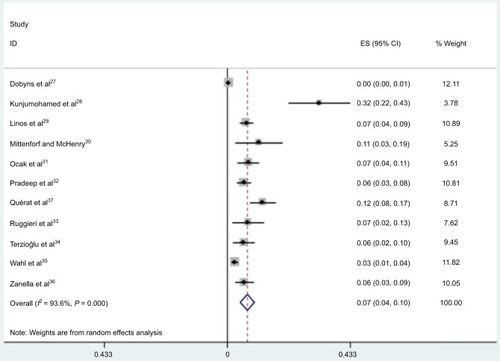
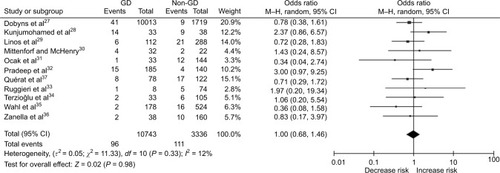
Figure 3 Forest plot for the pooled OR in surgery-treated hyperthyroid patients with and without GD.
Abbreviations: GD, Graves’ disease; OR, odds ratio; CI, confidence interval; M–H, Mantel–Haenszel.