Figures & data
Table 1 Relationship between LC3B, E-cadherin, and Vimentin expression and clinicopathological characteristics in GC
Table 2 Expressions of LC3B, E-cadherin, and Vimentin in GC tissue and N tissue
Figure 1 Box and whiskers plots of Oncomine data on LC3B (A–C), E-cadherin (D–F), and Vimentin (G–I) mRNA levels in GC and normal tissues.
Abbreviation: GC, gastric cancer.
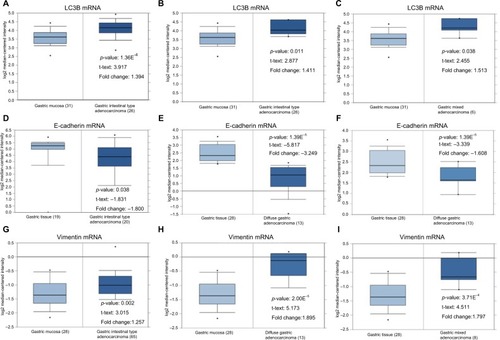
Figure 2 Representative examples of LC3B, E-cadherin, and Vimentin expression (200×).
Notes: Low LC3B expression in paired nontumor (A) and GC tissues (C), high LC3B expression in adjacent normal (B) and GC tissues (D), comparisons of LC3B expression in adjacent normal and GC tissues (E), low E-cadherin expression in adjacent normal (F) and GC tissues (H), high E-cadherin expression in adjacent normal (G) and GC tissues (I), comparisons of E-cadherin expression in adjacent normal and GC tissues (J), low Vimentin expression in adjacent normal (K) and GC tissues (M), high Vimentin expression in adjacent normal (L) and GC tissues (N), comparisons of Vimentin expression in adjacent normal and GC tissues (O).
Abbreviations: GC, gastric cancer; N, adjacent normal tissue; T, GC tissue.
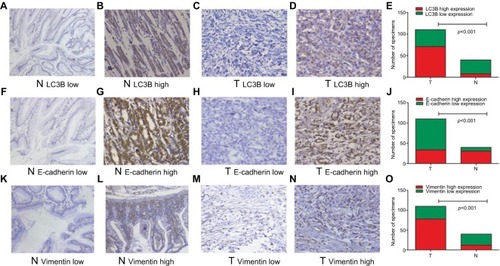
Table 3 Correlations between LC3B with E-cadherin and Vimentin in GC
Table 4 Multivariate analysis of OS for GC patients
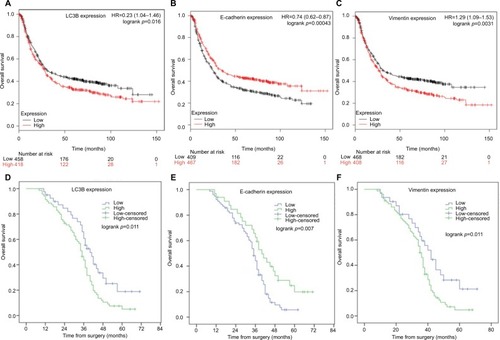
Figure 3 The prognostic value of LC3B, E-cadherin, and Vimentin expression in GC patients.
Notes: OS curves of are plotted for patients with tumors expressing low or high levels LC3B (A), E-cadherin (B), and Vimentin (C) mRNA in Kaplan–Meier plotter database (N=876). OS curves are plotted for patients with tumors expressing low or high levels LC3B (D), E-cadherin (E), and Vimentin (F) in our retrospective cohort (N=110). P-value was calculated by log-rank test and p<0.05 was regarded as statistically significant.
Abbreviations: GC, gastric cancer; OS, overall survival.