
Figures & data
Table 1 Baseline characteristics of patients with CATS or UOBC from the SEER database 1990–2012
Figure 1 Kaplan–Meier plots of the 10-year BCSS and OS were utilized to compare CATS and UOBC.
Notes: Patients with CATS had a worse survival than the UOBC population for BCSS (competing risks analysis P=0.001) (A). There was no statistical significance in the 10-year OS between CATS and UOBC (78% vs 78.8%, log-rank test P=0.161) (B).
Abbreviations: BCSS, breast cancer-specific survival; CATS, carcinoma of the axillary tail of Spence; OS, overall survival; UOBC, upper outer quadrant breast cancer.
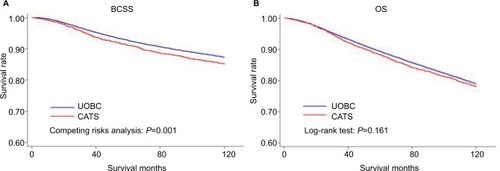
Table 2 Multivariate Cox regression model analysis of the BCSS and OS between CATS and UOBC
Figure 2 Kaplan–Meier plots of the 10-year BCSS comparing 1:1 matched CATS and UOBC cases.
Notes: The survival analysis of the matched groups showed that CATS presented a worse outcome for the BCSS (10-year BCSS: 85% vs 87.4%, competing risks analysis P=0.019).
Abbreviations: BCSS, breast cancer-specific survival; CATS, carcinoma of the axillary tail of Spence; PSM, propensity score matching; UOBC, upper outer quadrant breast cancer.
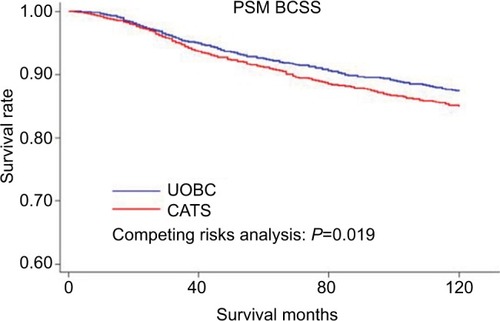
Figure 3 Forest plot of the hazard ratios for CATS versus UOBC in the subgroup analysis.
Notes: The forest plots of the HRs in the subgroups were plotted to describe the stratified prognosis value of ATS location of breast cancer. The HRs of CATS versus UOBC were significant in most of the subgroups for BCSS (A) and in almost half of the subgroups for OS (B).
Abbreviations: ATS, axillary tail of Spence; BCSS, breast cancer-specific survival; CATS, carcinoma of the axillary tail of Spence; HoR, hormone receptor; HR, hazard ratio; LN, lymph node; OS, overall survival; UD, undifferentiated; UOBC, upper outer quadrant breast cancer; IDC, infiltrating duct carcinoma; ILC, infiltrating lobular carcinoma.
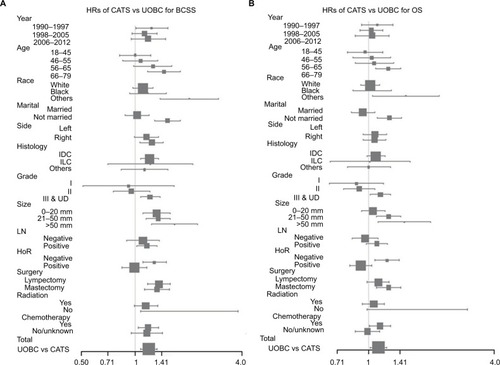
Table 3 Multivariate logistic regression analysis on LN metastasis