Figures & data
Table 1 Human tumor specimens imaged with a CLE
Figure 1 Principle of CLE. (A) Simplified scheme of probe-based CLE and principle of 2D image formation due to sweeping scanning movement of the laser beam. (B) Image representing the Z-stack formation principle. Individual images of a tumor taken with CLE are combined into a Z-stack. The 3 µm between the images corresponds to a Z step; 30 µm is the total scanned depth.
Note: Used with permission from Barrow Neurological Institute.
Abbreviations: 2D, two-dimensional; CLE, confocal laser endomicroscopy.
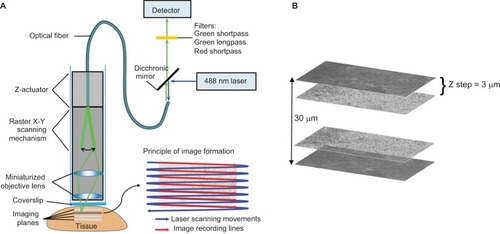
Table 2 Statistics on the CLE Z-stacks acquired from human and mouse brain tissues
Figure 2 2D (top) and 3D (bottom) LSM images of the same field of view showing the glioma border in mouse brain tissue. FNa was given intraoperatively, and the specimen was counterstained with Hoechst immediately ex vivo. Confocal images show higher signals of fluorescence within the tumor area with visible contours of individual tumor cells. Some of the tumor cells absorbed FNa, whereas others did not and appear darker than surrounding background. RBCs appear as hypointense areas of darkening. Hoechst stain provides visualization of nuclei and does not appear fluorescent within areas that represent the locations of RBCs. Overlapping the two images helps to confirm and reduce uncertainty between the individual characterizations of tumor versus RBCs. The lower row of images represents the 3D-reconstruction volume viewer images that were compiled using images obtained from a Z-stack. The images are angulated to help visualize the 3D nature of the image. Scale bar is 50 µm.
Note: Used with permission from Barrow Neurological Institute.
Abbreviations: 2D, two-dimensional; 3D, three-dimensional; FNa, fluorescein sodium; LSM, laser scanning microscope; RBC, red blood cell.
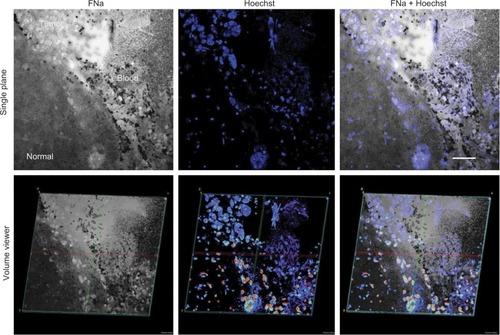
Figure 3 Representative images showing a collection of RBCs rather than tumor cells. (A) Projections of Z-stack CLE images taken from a mouse glioma. (B) Correlative H&E section displaying abundant RBCs within the tumor core. (C) A 3D volumetric view shows extravasated RBCs found near the tumor core. RBCs are on the left, and neoplastic tumor cells are on the right. The Z-stacks and volumetric view allow for better visualization and differentiation of cells, including RBCs, compared with the single-frame CLE image.
Note: Used with permission from Barrow Neurological Institute.
Abbreviations: 3D, three-dimensional; CLE, confocal laser endomicroscopy; H&E, hematoxylin and eosin; RBC, red blood cell.
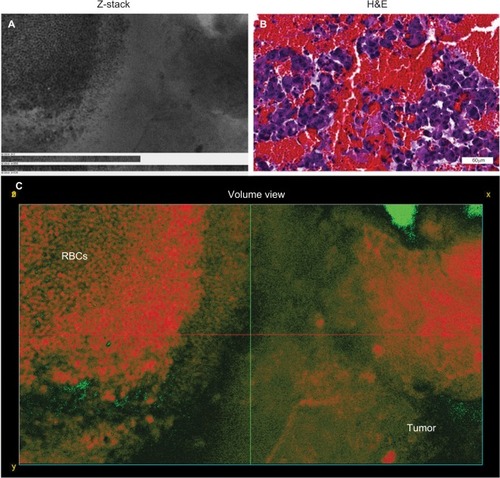
Figure 4 Representative images of a mouse glioma specimen. (A) CLE Z-stack projection showing tumor border. (B) Correlative H&E-stained section. (C) Volumetric view of the same field of view as in (A) affords a more detailed reconstruction and visualization of the cellular pattern—a feature that is not possible in the H&E-stained slice. Image was colorized using a single-channel custom spectrum LUT (Fiji). Cells are shown in shades of orange on the left, as well as normal brain tissue on the right. Fluorescein signal gradient is pseudocolored in green. (D) Enlarged view of the tumor border taken from the volumetric view shown in (C). Nuclear staining is pseudocolored in blue, cytoplasm in magenta, and fluorescein leaking around the tumor in green.
Note: Used with permission from Barrow Neurological Institute.
Abbreviations: 3D, three-dimensional; CLE, confocal laser endomicroscopy; H&E, hematoxylin and eosin; LUT, look-up table; RBC, red blood cell.
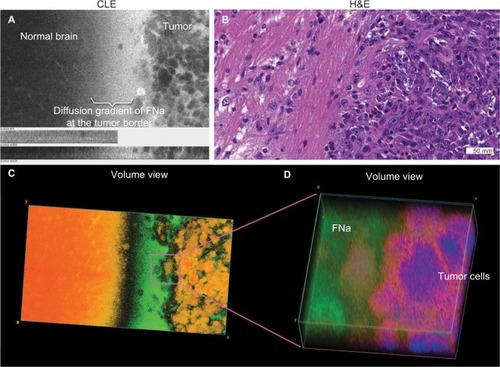
Figure 5 Representative single-plane (top row) and volumetric (bottom row) LSM images of normal brain (left), injured brain (center), and mouse glioma tissue (right) after FNa injection. The normal brain tissue contains evenly distributed autofluorescent inclusions and no FNa leakage within the tissue. FNa leakage from vessels and staining of the adjacent brain tissue is seen in the middle column, consistent with injury to brain tissue. The single plane image of the tumor area shows a classic pattern of FNa leakage around the tumor cells. Some tumor cells have taken up fluorescent dye and appear bright (yellow inset). Abnormal cell shape and size can be appreciated through CLE (blue inset). The 3D view of these patterns enhances the viewer’s visualization of the field of view and allows appreciation of additional details regarding tissue architecture, vascular structures, and gross tumor cell shape. Scale bars are 50 µm.
Note: Used with permission Barrow Neurological Institute.
Abbreviations: 3D, three-dimensional; CLE, confocal laser endomicroscopy; FNa, fluorescein sodium; LSM, laser scanning microscope.
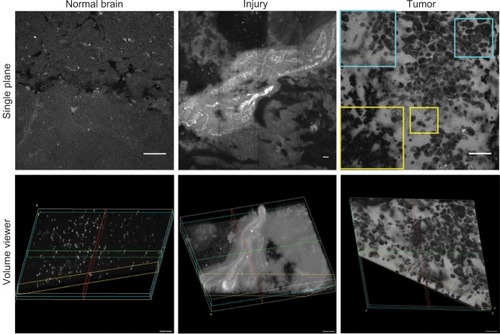
Figure 6 Representative images of a mouse glioma showing abnormal microvasculature, specifically abnormal capillaries (upper row) and abnormal large vascular channels within the tumor (lower row). (A) and (D) represent 2D projections of CLE Z-stacks shown in volumetric views (B) and (E), respectively. Correlative histologic slides stained with H&E from the same tumor sites are shown in (C) and (F). The vascular pattern cannot be fully appreciated on 2D CLE and H&E images; however, the volumetric views allow the viewer to see the abnormal vasculature patterns. Image (B) shows areas of bright fluorescence in green, whereas areas of darkness are in orange. On the right side of the image, the dye infiltration into loosely arranged tumor cells can be appreciated. The volumetric view is presented as a single channel using customized spectrum LUT (Fiji).
Note: Used with permission from Barrow Neurological Institute.
Abbreviations: 2D, two-dimensional; CLE, confocal laser endomicroscopy; H&E, hematoxylin and eosin; LUT, look-up table.
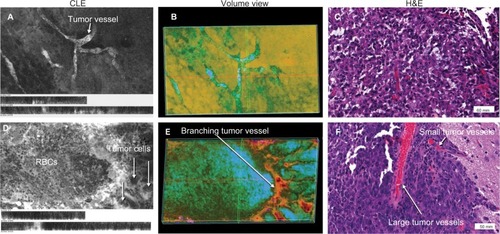
Figure 7 Representative CLE images and H&E-stained tissue from a patient with meningioma, who was injected with FNa intraoperatively. (A) Projection of a Z-stack showing a typical picture of a meningioma. (B) Volumetric images from the same field of view as in (A) display depth tissue characteristics and a cut through a psammoma body pseudocolored in blue. Both 2D and volumetric CLE images show projections of multiple round and spherical structures that resemble the characteristic psammoma bodies found in meningiomas. (C) Correlative H&E image from the same specimen.
Note: Used with permission from Barrow Neurological Institute.
Abbreviations: 2D, two-dimensional; CLE, confocal laser endomicroscopy; FNa, fluorescein sodium; H&E, hematoxylin and eosin.
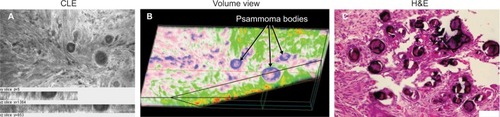
Figure 8 Human meningioma sample stained with different fluorescent dyes ex vivo. Each row consists of a CLE Z-stack image (A and D), the corresponding 3D volumetric view (B and E), and an H&E-stained histological section for comparison (C and F). Both series of images represent a section of a human meningioma that was stained with AO (upper row) or AF (lower row). Both dyes provide good visualization of cellular structure compared with their histologic counterparts.
Note: Used with permission Barrow Neurological Institute.
Abbreviations: 3D, three-dimensional; AF, acriflavine; AO, acridine orange; CLE, confocal laser endomicroscopy; H&E, hematoxylin and eosin.
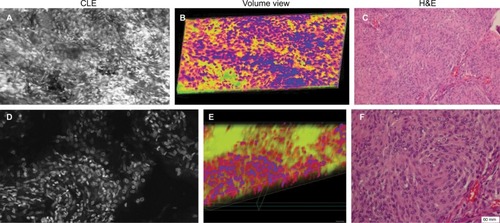
Figure 9 Images of a human glioblastoma multiforme. (A) Single-frame CLE image from the Z-stack. (B) Volumetric view with nuclei pseudocolored in blue, cytoplasm in red, and fluorescein diffusion in the tissue in yellow. (C) H&E-stained section of the same specimen showing the typical palisading pattern of a glioblastoma. Abnormally big contours of the neoplastic cells are visible on the right part of CLE images and are even better represented in the 3D rendering of the Z-stack.
Note: Used with permission from Barrow Neurological Institute.
Abbreviations: 3D, three-dimensional; CLE, confocal laser endomicroscopy; H&E, hematoxylin and eosin.
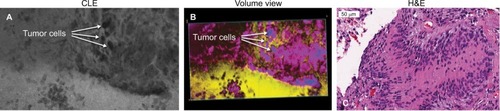
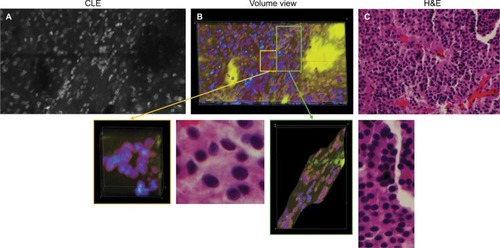
Figure 10 Representative images of a pituitary adenoma rapidly stained ex vivo with AO. (A) Single frame from a Z-stack acquired with a CLE. (B) Volumetric view of the same field of view. The yellow and green rectangular sections of image (B) are enlarged to show greater detail and cellular structures. (C) Circular and linear cell arrangements are shown in the correlative H&E section of the same specimen.
Note: Used with permission from Barrow Neurological Institute.
Abbreviations: 3D, three-dimensional; AO, acridine orange; CLE, confocal laser endomicroscopy.