Figures & data
Table 1 Characteristics of locally advanced rectal cancer patients
Figure 1 ROC curve analysis of CEA and CA19-9 for downstaging with locally advanced rectal cancer after nCRT.
Abbreviations: CA19-9, carbohydrate antigen 19-9; CEA, carcinoembryonic antigen; nCRT, neoadjuvant chemoradiotherapy; ROC, receiver operating characteristic.
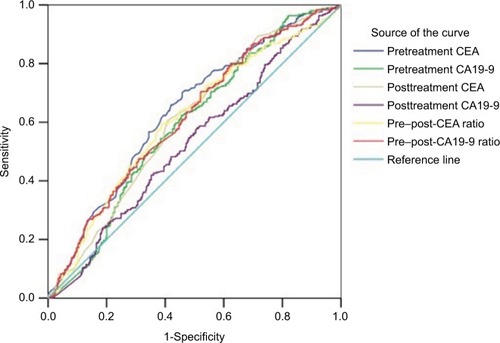
Figure 2 ROC curve analysis of CEA and CA19-9 for pCR with locally advanced rectal cancer after nCRT.
Abbreviations: CA19-9, carbohydrate antigen 19-9; CEA, carcinoembryonic antigen; nCRT, neoadjuvant chemoradiotherapy; pCR, pathological complete response; ROC, receiver operating characteristic.
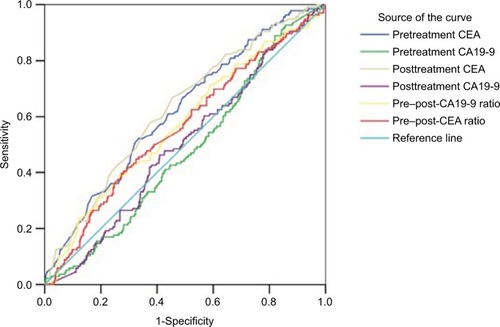
Table 2 Characteristics for downstaging with locally advanced rectal cancer after nCRT
Table 3 Characteristics for pCR with locally advanced rectal cancer after nCRT
Table 4 Multivariate analyses of predictors for downstaging with locally advanced rectal cancer after nCRT
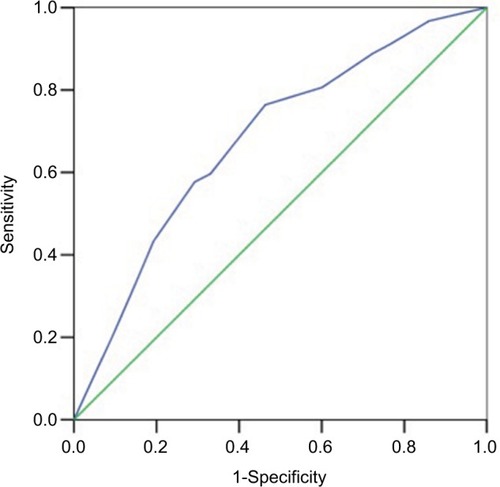
Figure 3 ROC curve analysis of 4-factor scoring system for downstaging with locally advanced rectal cancer after nCRT.
Abbreviations: nCRT, neoadjuvant chemoradiotherapy; ROC, receiver operating characteristic.