Figures & data
Table 1 Biological and clinical characteristics
Figure 1 Mutational spectrum of all genes with >5% mutation frequency.
Note: NPM1 was the most frequently combined mutation gene (n=28, 54.9%), followed by FLT3 (n=21, 41.2%), IDH1 (n=11, 21.6%), TET2 (n=6, 11.8%), SMC3 (n=6, 11.8%), IDH2 (n=5, 9.8%), NRAS (n=5, 9.8%), KRAS (n=4, 7.8%), MT-CYB (n=4, 7.8%), CEBPA (n=3, 5.9%), PTPN11 (n=3, 5.9%), U2AF1 (n=3, 5.9%), SMC1A (n=3, 5.9%), and RAD21 (n=3, 5.9%).
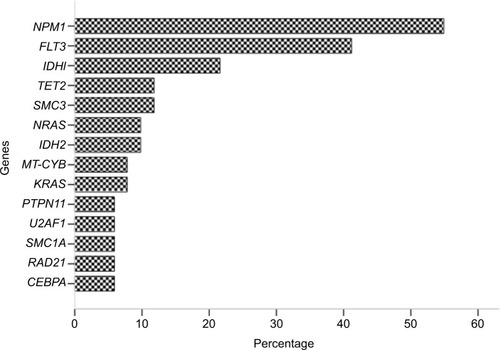
Table 2 Kaplan–Meier analysis for EFS and OS between different biological and clinical character groups
Figure 2 Comparison of EFS and OS between different biological and clinical character groups.
Notes: (A and B) EFS and OS of DNMT3Amut/NPM1wild vs DNMT3Amut/NPM1mut in all of the 51 patients. (C and D) EFS and OS of DNMT3Amut/NPM1wild vs DNMT3Amut/NPM1mut in 28 patients with chemotherapy. (E and F) EFS and OS of DNMT3Amut/NPM1wild vs DNMT3Amut/NPM1mut in 23 patients with HSCT.
Abbreviations: EFS, event-free survival; HSCT, hematopoietic stem cell transplantation; OS, overall survival.
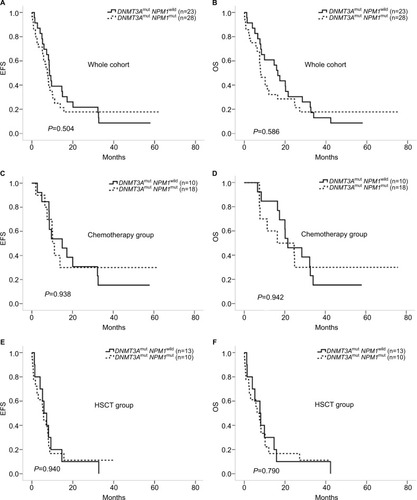
Figure 3 Comparison of chemotherapy and HSCT in different mutation groups.
Notes: (A and B) EFS and OS of all the 51 patients. (C and D) EFS and OS of the 23 patients with DNMT3Amut/NPM1wild. (E and F) EFS of the 28 patients with DNMT3Amut/NPM1mut.
Abbreviations: EFS, event-free survival; HSCT, hematopoietic stem cell transplantation; OS, overall survival.
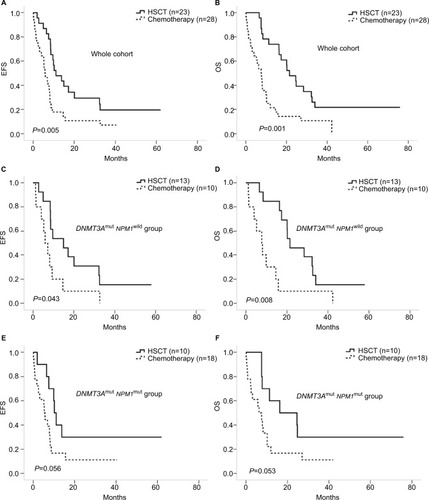
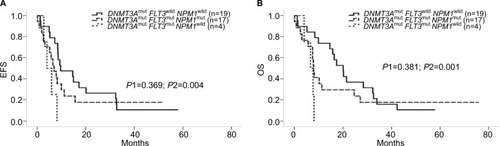
Figure 4 Influences of FLT3-ITD/TKD to the cohort.
Notes: (A and B) EFS and OS of DNMT3Amut/FLT3wild/NPM1wild vs DNMT3Amut/FLT3mut/NPM1mut vs DNMT3Amut/FLT3mut/NPM1wild; P1 for comparison between DNMT3Amut/FLT3wild/NPM1wild and DNMT3Amut/FLT3mut/NPM1mut; P2 for comparison between DNMT3Amut/FLT3wild/NPM1wild vs DNMT3Amut/FLT3mut/NPM1wild.
Abbreviations: EFS, event-free survival; OS, overall survival.