Figures & data
Table 1 Clinicopathological characteristics of patient samples and expression of hsa_circ_0128298 in hepatocellular carcinoma
Figure 1 The detailed experimental process.
Notes: circRNA expression profiles were screened in three paired human HCC and paratumorous tissues. Targeted circRNAs were verified by qRT-PCR via initial verification in 30 pairs of samples and extended verification in 78 pairs of samples.
Abbreviations: circRNAs, circular RNAs; HCC, hepatocellular carcinoma; qRT-PCR, quantitative real-time polymerase chain reaction.
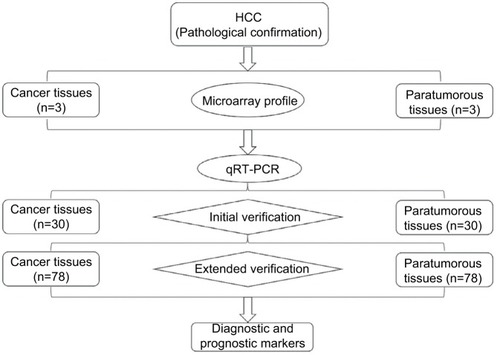
Figure 2 Overview of the microarray signatures.
Notes: (A) Unsupervised clustering analysis clearly distinguished the tumors and their corresponding nontumorous samples. (B) Illustration of the human genome showing the overall expression profile of the samples. (C) The whole transcriptome profiles of the tumor and their adjacent paratumor tissues were highly correlated. (D) Volcano plot showing the significantly deregulated genes in tumor samples.
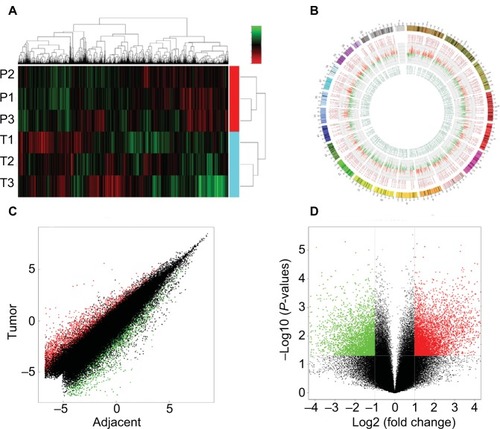
Figure 3 Target circRNAs from the initial verification from 30 pairs of samples.
Notes: (A and B) Increased expression of hsa_circ_0091582 and hsa_circ_0128298 in HCC tissues. RT-PCR was used to determine the expression levels. The ΔCt values were determined by subtracting the Ct value for GAPDH from the Ct values for circRNAs. Larger ΔCt values indicate higher expression (n=30, P=0.023 and n=30, P=0.024, respectively). (C and D) The ROC curve for using hsa_circ_0091582 and hsa_circ_0128298 as biomarkers (P=0.017 and 0.029, respectively).
Abbreviations: circRNAs, circular RNAs; GAPDH, glyceraldehyde-3-phosphate dehydrogenase; HCC, hepatocellular carcinoma; ROC, receiver operating characteristics; RT-PCR, real-time polymerase chain reaction; AUC, area under the curve.
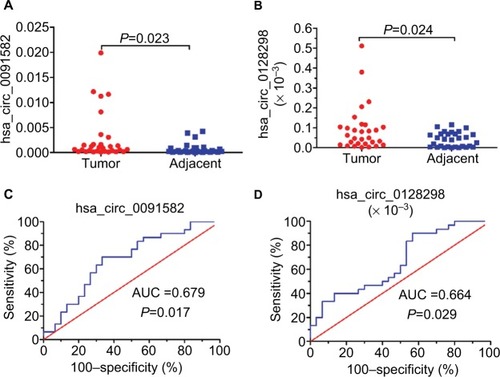
Figure 4 The expression levels and diagnostic value of hsa_circ_0128298.
Notes: (A) Increased expression of hsa_circ_0128298 in HCC tissues (P=0.006). (B) The ROC curve of using hsa_circ_0128298 as a biomarker (P<0.001, AUC =0.668).
Abbreviations: AUC, area under the curve; ROC, receiver operating characteristics.
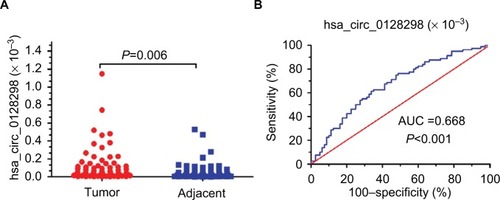
Table 2 Correlation between hsa_circ_0128298 expression and clinicopathological characteristics of hepatocellular carcinoma patients
Table 3 Spearman analysis of correlation between hsa_circ_0128298 and clinicopathological characteristics
Table 4 Univariate and multivariate analyses of various prognostic parameters in patients with HCC (Cox regression analysis)
Figure 5 hsa_circ_0128298 can be an independent prognostic factor to predict OS.
Note: Kaplan–Meier’s analyses of correlations between the hsa_circ_0128298 expression levels and OS of 78 HCC patients are shown.
Abbreviations: HCC, hepatocellular carcinoma; OS, overall survival.
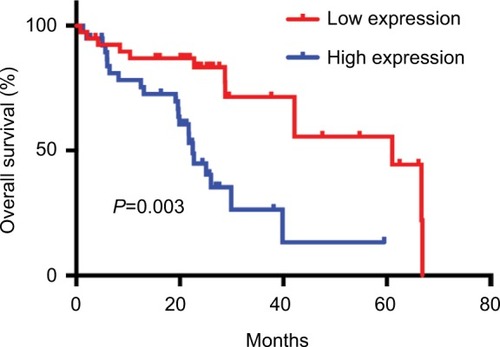
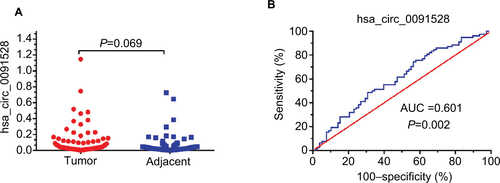
Figure S1 The expression levels and diagnostic value of hsa_circ_0091528.
Abbreviation: AUC, area under the curve.