Figures & data
Figure 1 CDK4/6 and mTOR inhibitors cross-regulate, leading to enhanced inhibition of the respective pathways when used in combination.
Notes: SF7761, SF8628, and SU-DIPG IV cells were treated with vehicle, 0.5 µM palbociclib, 10 µM temsirolimus, or coadministered 0.5 µM palbociclib with 10 µM temsirolimus for 24 hours prior to total protein extraction and immunoblot analyses. Quantitative densitometry values are shown below each blot. Densitometry graphs compare single-agent treatments and combination treatment to vehicle-treated controls (right). β-actin was used as a loading control. Data are the mean ± SEM of triplicate determinations in all instances. *p < 0.05; **p < 0.01; ***p < 0.001 (compared to respective vehicle treatment). #p < 0.05; ##p < 0.01; ###p < 0.001 (compared to respective temsirolimus single-agent treatment).
Abbreviations: RB, retinoblastoma protein; CDK, cyclin-dependent kinase; mTOR, mechanistic target of rapamycin protein; S6K, p70 ribosomal protein S6 kinase; 4EBP1, eukaryotic translation initiation factor 4E-binding protein 1; rictor, rapamycin-insensitive companion of mammalian target of rapamycin; p-, phosphorylated form of protein.
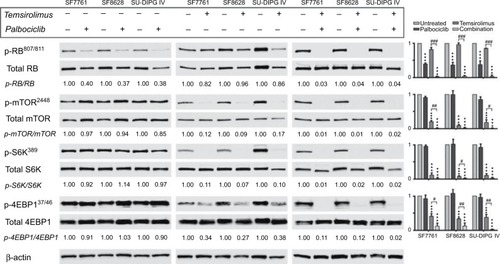
Figure 2 Coadministration of palbociclib with temsirolimus yields beneficial enhancement of CDK4/6 and mTOR inhibition in DIPG cells.
Notes: SF7761 cells were treated with a range of doses of palbociclib, temsirolimus or temsirolimus coadministered with 0.5 µM palbociclib for 24 hours prior to total protein extraction. Immunoblot analyses showed palbociclib and temsirolimus effectively inhibited CDK4/6-cycD1-RB and mTOR signaling pathways in DIPG cells, respectively, while each drug also exhibits inherent attributes to disrupt the other’s target protein, leading to an ostensible synergistic outcome when used in combination. Quantitative densitometry values are shown below each blot. Densitometry graphs compare single-agent temsirolimus treatment and temsirolimus given in combination with 0.5 µM palbociclib (right). The dotted line emphasizes 0.5 µM palbociclib single-agent results versus combination effects. β-actin was used as a loading control. Data are the mean ± SEM of triplicate determinations in all cases. #p < 0.05; ##p < 0.01; ###p < 0.001 (compared to respective temsirolimus single-agent treatment).
Abbreviations: RB, retinoblastoma protein; CDK, cyclin-dependent kinase; mTOR, mechanistic target of rapamycin protein; S6K, p70 ribosomal protein S6 kinase; 4EBP1, eukaryotic translation initiation factor 4E-binding protein 1; rictor, rapamycin-insensitive companion of mammalian target of rapamycin; p-, phosphorylated form of protein; PD, palbociclib; TM, temsirolimus.
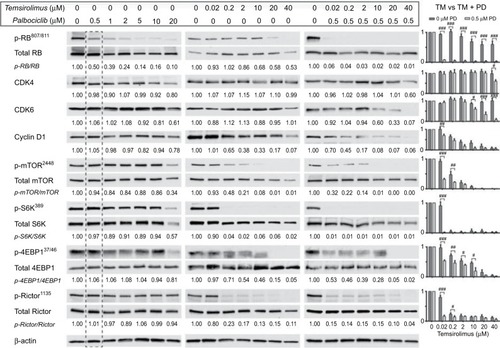
Table 1 IC50 values for 24-hour single-agent and combination treatments in SF7761, SF8628, and SU-DIPG IV cells
Figure 3 Palbociclib and temsirolimus treatments as monotherapies reduce cell viability in DIPG.
Notes: (A) calcein-AM cell viability assays were conducted on SF7761, SF8628, and SU-DIPG-IV DIPG cell lines treated with increasing concentrations of palbociclib for 24 hours. (B) drug cytotoxicity was measured following 24 hours treatment with palbociclib, using ethidium homodimer-1 (ethD-1). (C) cell viability assays were conducted on SF7761, SF8628, and SU-DIPG IV cell lines treated with increasing concentrations of temsirolimus for 24 hours. (D) drug cytotoxicity was measured following 24-hour treatment with temsirolimus, using ethD-1. Data are the mean ± SEM of triplicate determinations. *p < 0.05, **p < 0.01, and ***p < 0.001 (compared with the respective vehicle treatment).
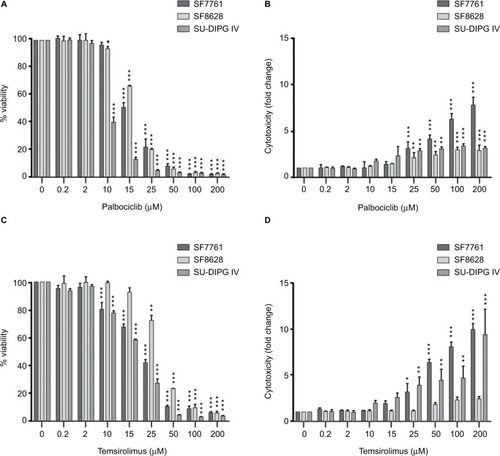
Figure 4 Coadministration of palbociclib and temsirolimus decreases cell viability synergistically.
Notes: SF7761 (A), SF8628 (B), and SU-DIPG IV (C) cells were treated with single-agent temsirolimus at increasing concentrations (0.2–200 µM) or in the same concentration range combined with a single fixed dose of palbociclib (2, 10, 12, 15, or 25 μM). Cell viability was assessed using calcein-AM staining. A combination index score was assigned to each of the different combinations and is shown on the right. Data are the mean ± SEM of triplicate determinations.
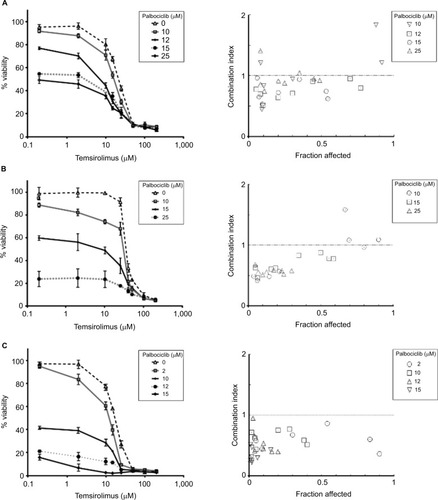
Figure 5 Coadministration of palbociclib and temsirolimus decreases cell viability principally through restricting cell proliferation.
Notes: Bivariate flow cytometric analyses of cell viability in SF7761 (A), SF8628 (B) and SU-DIPG IV (C) cells. Cells were treated with palbociclib (0–50 mM), temsirolimus (0–50 mM) or both (temsirolimus 0–50 mM, with a fixed dose of either 10 mM or 15 mM palbociclib, dependent on cell line sensitivity). Analysis of “% live cells” (calcein-AM positive), “% dead cells” (ethD-1 positive) and “% dying cells” (double positive) was performed. The dotted line box in each of the panels on the left-hand side emphasizes the dose of palbociclib used for the combinatorial analyses. Data are the mean ± SEM of triplicate determinations.
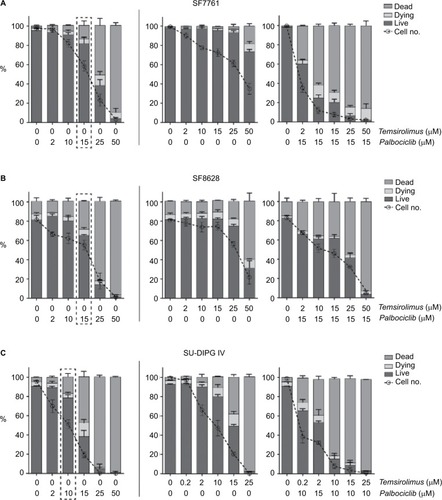
Figure 6 Palbociclib and temsirolimus inhibit the growth of DIPG cells cytostatically.
Notes: SF7761 (A), SF8628 (B), and SU-DIPG IV (C) cells were treated with vehicle, palbociclib (2 µM), or temsirolimus (10 µM for SF7761 and SF8628; 0.2 µM for SU-DIPG IV) for 0–72 hours. Cells were then counted and stained with calcein-AM to deduce % viability by using flow cytometry. Data are the mean ± SEM of triplicate determinations in all cases.
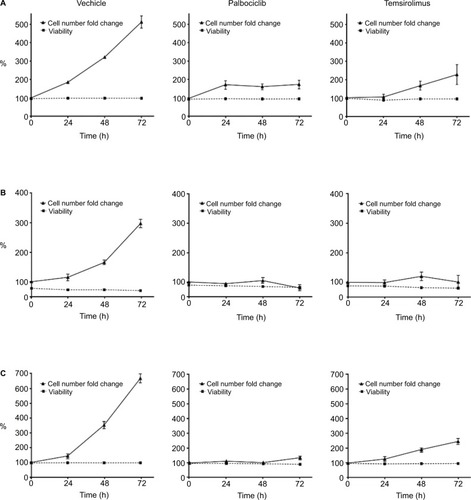
Figure 7 Palbociclib and temsirolimus treatments lead to cell cycle arrest.
Notes: (A) DRAQ5 fluorescent dye was used to conduct flow cytometric cell cycle analysis on SF7761 cells treated with vehicle, 2 μM palbociclib, or 10 μM temsirolimus for 24 hours. (B) DRAQ5 cell cycle analysis of SF7761, SF8628, and SU-DIPG IV cells treated with 2 μM palbociclib demonstrated a significant increase in the percentage of cells in the G0–G1 phase over time. (C) DRAQ5 cell cycle analysis of SF7761 and SF8628 cells treated with 10 µM temsirolimus, and SU-DIPG IV cells treated with 0.2 μM temsirolimus, demonstrated a significant increase in the percentage of cells in the G0–G1 phase over time. (D) SU-DIPG IV cells were treated with temsirolimus, or the combination of temsirolimus and 0.5 µM palbociclib for 24–72 hours, and colonies were counted after 14 days. Representative plates following 72 hours treatment are shown (right). Data are the mean ± SEM of triplicate determinations in all cases. *p < 0.05, **p < 0.01, and ***p < 0.001 (compared with respective vehicle treatment).
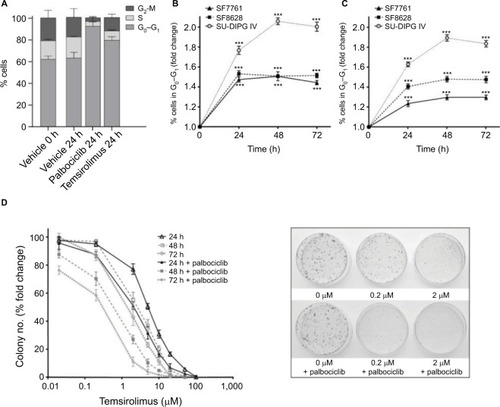
Figure 8 Treatment of rat hippocampal primary cultures with palbociclib did not elicit cytotoxicity.
Notes: Primary hippocampal culture treated with vehicle solution or 2 µM palbociclib for 24 hours. Intact neuronal networks and normal glial cell morphology was observed in cultures treated with palbociclib, suggesting no significant toxicity. Cell nuclei were stained with DAPI (blue); neurons were stained with B3 tubulin antibody (green); glial cells were stained with the GFAP antibody (red/orange).
Abbreviations: DAPI, 4′,6-diamidino-2-phenylindole; B3 tubulin, tubulin, beta III isoform; GFAP, glial fibrillary acidic protein.
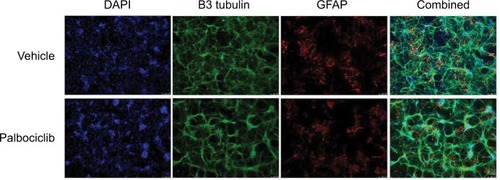
Figure 9 Direct delivery of palbociclib into rat brain did not elicit discernible toxicity.
Notes: Palbociclib was infused into the striatum of rat brains at a rate of 1 µL/min (5 µL total) at either 100 or 400 µM. Tissue was harvested after 48 hours and analyzed using immunofluorescence staining. Tissue morphology appeared normal in rats dosed with palbociclib, suggesting no significant toxicity. Cell nuclei were stained with DAPI (blue); neurons were stained with NeuN antibody (green); glial cells were stained with GFAP antibody (red).
Abbreviations: DAPI, 4′,6-diamidino-2-phenylindole; NeuN, neuronal nuclear protein; GFAP, glial fibrillary acidic protein.
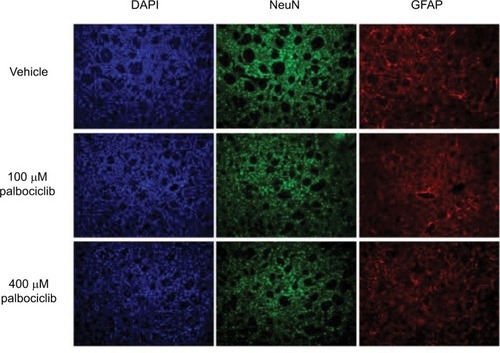
Figure S1 DIPG cells, ostensibly, do not express p16INK4A.
Notes: Immunoblot using p16INK4A-specific antibody against protein from SF7761, SF8628, and SU-DIPG IV cells treated with vehicle (−) or 10 μM palbociclib (+) for 24 hours. HeLa cell protein was used as a positive control for p16INK4A expression. ®-actin was used as a loading control. Representative immunoblot of three determinations.
Abbreviation: p16INK4A, cyclin-dependent kinase inhibitor 2A.
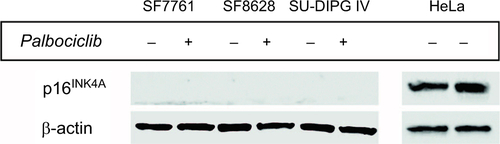
Figure S2 Logarithmic dose-response curves for palbociclib and temsirolimus single-agent and combination treatments.
Notes: (A) SF7761, (B) SF8628, and (C) SU-DIPG IV cells were treated for 24 hours with increasing concentrations of single-agent palbociclib (0.2–200 µM), single-agent temsirolimus (0.2–200 μM) or temsirolimus (0.2–200 μM) combined with a single fixed dose of palbociclib (2, 10, 12, 15 or 25 μM). Cell viability was assessed using calcein-AM staining and an IC50 modeled in each instance. Data are the mean ± SEM of triplicate determinations.
Abbreviations: PD, palbociclib; TM, temsirolimus.
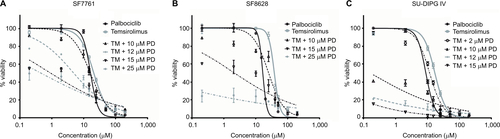
Figure S3 Representative cell cycle analysis histograms illustrating G1-S arrest in DIPG cells in response to palbociclib and temsirolimus treatment compared to control cells.
Notes: SF7761 cells were treated with vehicle, 2 μM palbociclib or 10 μM temsirolimus for 0, 24, 48, or 72 hours, as shown. DRAQ5 fluorescent dye was used to conduct flow cytometric cell cycle analysis on cells following treatment. G1 peak (left), G2 peak (right), and S-phase cells (transitional central area) are shown in all instances. Percentage value (top right) indicates the percentage of total cells in G1 phase. Each panel is a representative histogram of three determinations.
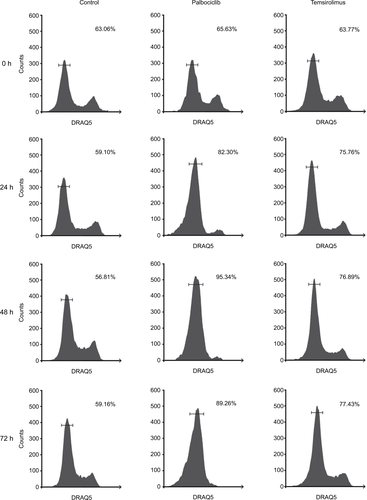
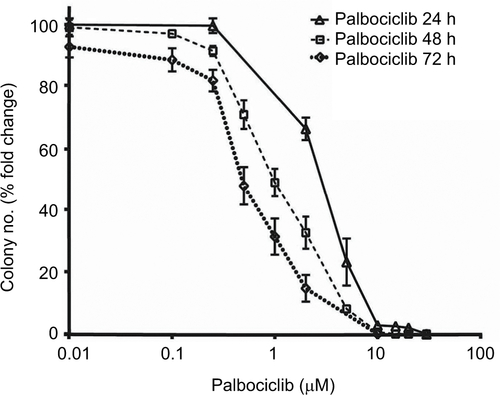
Figure S4 Palbociclib dose-dependently reduces clonogenicity in DIPG cells.
Notes: SU-DIPG IV cells were treated with different concentrations of palbociclib for 24–72 hours, and colonies were counted after 14 days. Data are the mean ± SEM of triplicate determinations.