Figures & data
Figure 1 Flowchart for the creation of the SEER patient dataset.
Abbreviations: AJCC, American Joint Committee on Cancer; ICD-O-3, International Classification of Diseases for Oncology, Third Edition; SEER, Surveillance, Epidemiology and End Results.
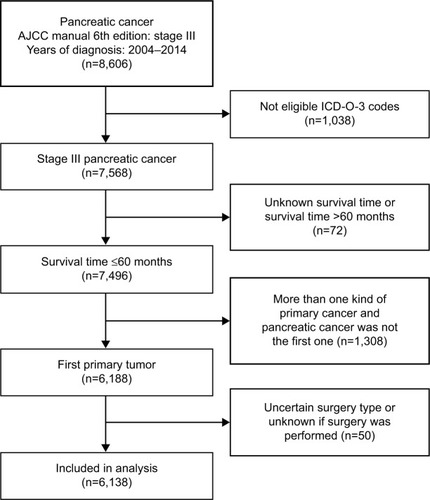
Table 1 Patient characteristics before and after PSM
Figure 2 Distribution of propensity score before and after propensity score analysis.
Notes: Left upper and lower panel show the distribution of the propensity score for patients with and without resection of the primary tumor before the matching procedure. Right upper and lower panel demonstrate the distribution of the propensity score after full propensity score matching.
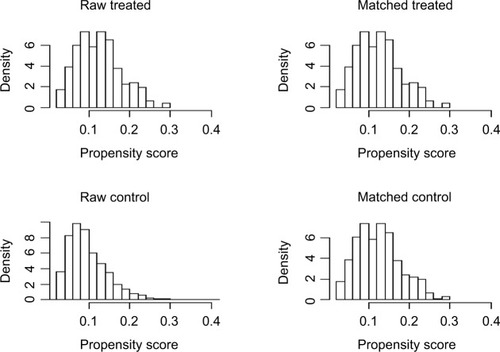
Table 2 Prognostic factors for CSS
Figure 3 Kaplan–Meier curve of CSS comparing the surgery group with the nonsurgery group before (A) and after (B) PSM.
Abbreviations: CSS, cancer-specific survival; PSM, propensity score matching.
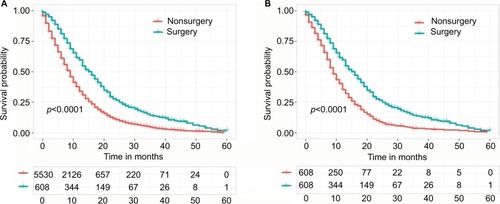
Table 3 CSS rate and median CSS before and after PSM
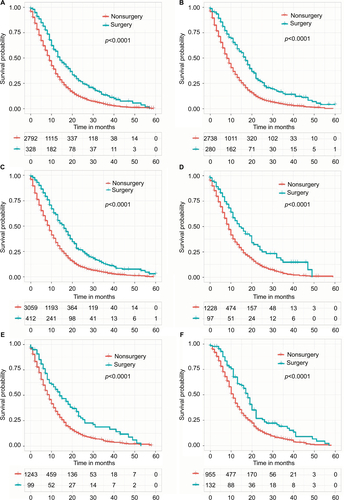
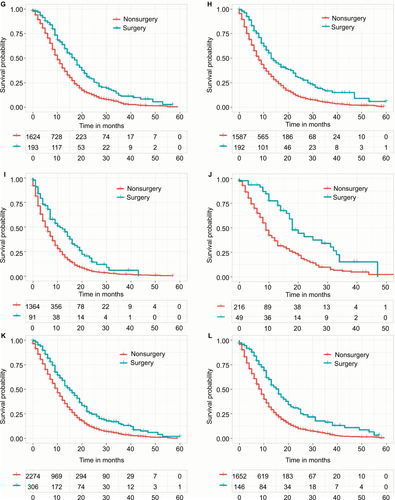
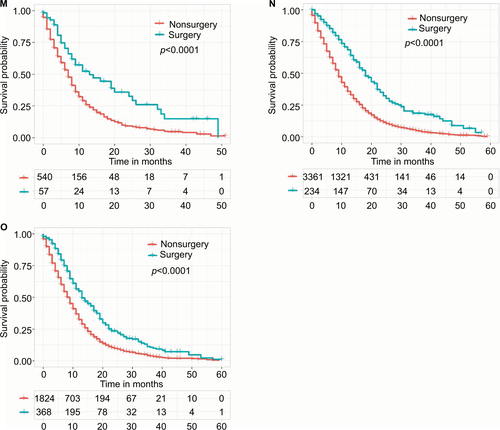
Figure S1 Kaplan–Meier curve of CSS comparing the surgery group with the nonsurgery group in different subgroups.
Notes: (A) Male subgroup; (B) Female subgroup; (C) Head tumor subgroup; (D) Body/tail tumor subgroup; (E) Other locations tumor subgroup; (F) Age <55 years subgroup; (G) Age 56–65 years subgroup; (H) Age 66–75 years subgroup; (I) Age >75 years subgroup; (J) Tumor size <20 mm subgroup; (K) Tumor size 20–40 mm subgroup; (L) Tumor size 40–60 mm subgroup; (M) Tumor size >60 mm subgroup; (N) N0 stage subgroup; and (O) N1 stage subgroup.
Abbreviation: CSS, cancer-specific survival.