
Figures & data
Table 1 Patient characteristics of the study population
Figure 1 Kaplan–Meier curves of BCSS and OS based on age for all patients in the younger group (15–35 years) vs older group (35–60 years).
Abbreviations: BCSS, breast cancer-specific survival; OS, overall survival.
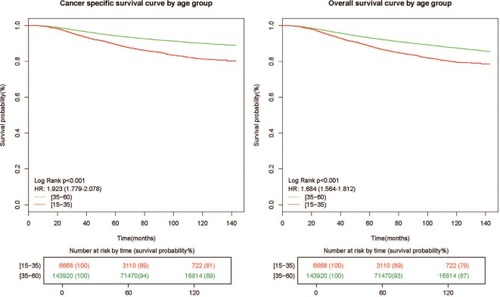
Table 2 Univariate and multivariate Cox proportional hazard model of BCSS
Table 3 Univariate and multivariate Cox proportional hazard model of OS
Figure 2 Kaplan–Meier curves of BCSS and OS of 1:1 matched groups based on age for all patients in the younger group (15–35 years) vs older group (35–60 years).
Abbreviations: BCSS, breast cancer-specific survival; OS, overall survival.
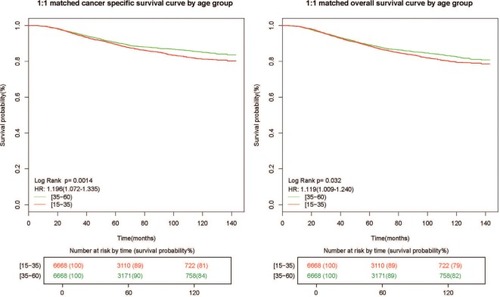
Figure 3 Subgroup analyses of BCSS based on lymph node status (N0, N1, N2, N3). The HR was calculated by multivariate Cox proportional hazard model adjusted for age, race, tumor size, grade, ER status, PR status, and HER2 status (Wald test).
Abbreviations: BCSS, breast cancer-specific survival; ER, estrogen receptor; PR, progesterone receptor; HER2, human epidermal growth factor receptor 2.
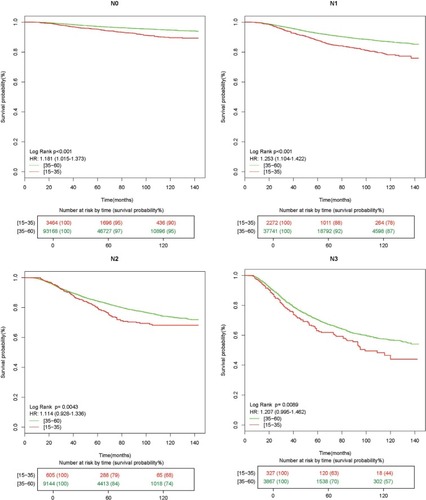
Figure 4 Subgroup analyses of OS based on lymph node status (N0, N1, N2, N3). The HR was calculated by multivariate Cox proportional hazard model adjusted for age, race, tumor size, grade, ER status, PR status, and HER2 status (Wald test).
Abbreviations: OS, overall survival; ER, estrogen receptor; PR, progesterone receptor; HER2, human epidermal growth factor receptor 2.
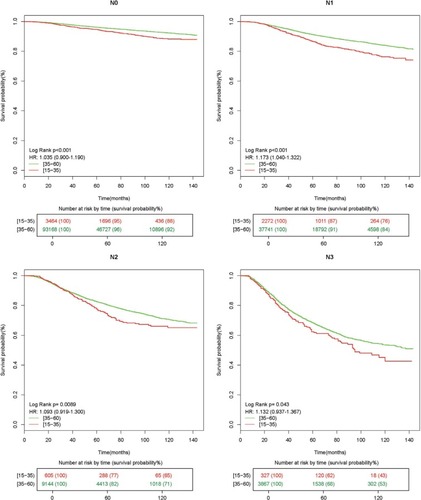
Figure 5 Subgroup analyses of BCSS and OS based on ER status (positive). The HR was calculated by multivariate Cox proportional hazard model adjusted for age, race, tumor size, lymph nodes, grade, PR status, and HER2 status (Wald test).
Abbreviations: BCSS, breast cancer-specific survival; OS, overall survival; ER, estrogen receptor; PR, progesterone receptor; HER2, human epidermal growth factor receptor 2.
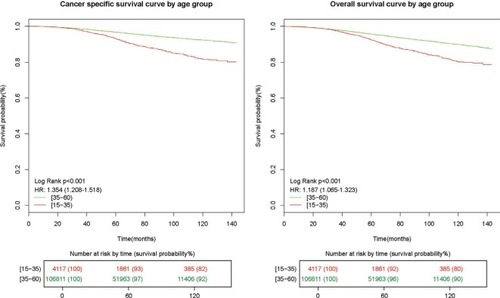
Figure 6 Subgroup analyses of BCSS and OS based on ER status (negative). The HR was calculated by multivariate Cox proportional hazard model adjusted for age, race, tumor size, lymph nodes, grade, PR status, and HER2 status (Wald test).
Abbreviations: BCSS, breast cancer-specific survival; OS, overall survival; ER, estrogen receptor; PR, progesterone receptor; HER2, human epidermal growth factor receptor 2.
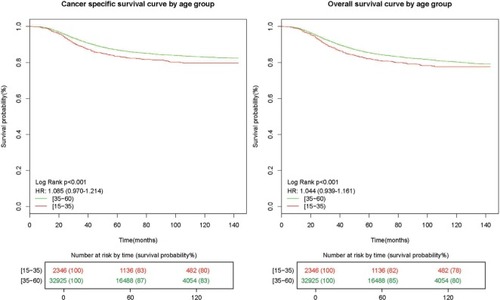
Figure 7 Cubic spline curve of the relationship between age and HR (BCSS and OS). Age was treated as a dummy variable categorized in two-year strata. Cox proportional hazard model (Wald test) was utilized to calculate the HR of each age group compared with the group (≥58 and <60) (reference).
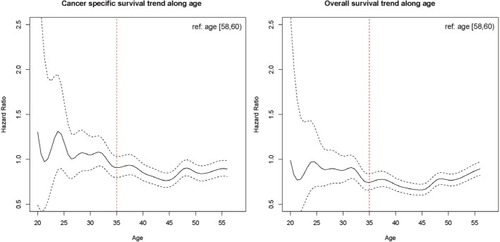
Table S1 Baseline characteristics of the younger and older patients in a 1:1 matched group
Table S2 Imputed multivariate Cox proportional hazard model of BCSS and OS