Figures & data
Table 1 Patient characteristics
Figure 1 ROC curve analysis was performed to calculate the optimal cutoff value of Ki67 expression.
Note: The Ki67 expression of the farthest point away from the chance line was 77.5%.
Abbreviations: AUC, area under curve; ROC, receiver operating characteristic.
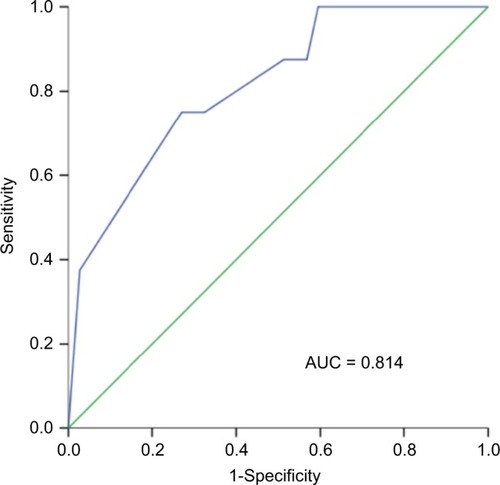
Figure 2 Association of Ki67 expression with overall survival (A) and progression-free survival (B).
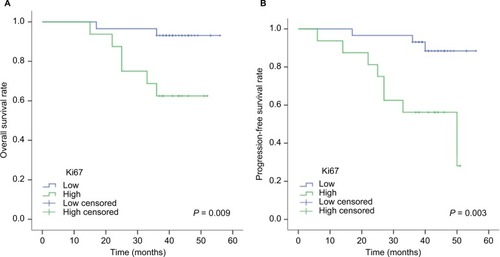
Figure 3 Association of the dNLR with overall survival (A) and progression-free survival (B).
Abbreviation: dNLR, derived neutrophil–lymphocyte ratio.
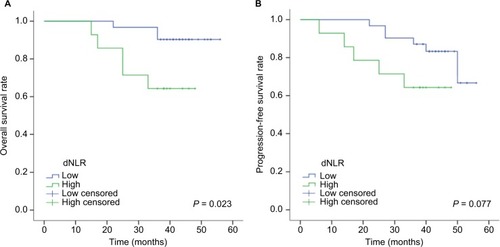
Table 2 Associations of Ki67 and dNLR with disease variables
Table 3 Multivariate analysis of the Cox risk ratio model for OS
Table 4 Multivariate analysis of the Cox risk ratio model for PFS
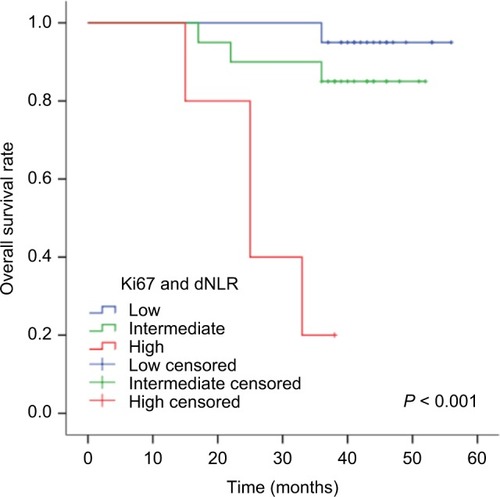
Figure 4 Kaplan–Meier survival curves for NPC patients concerning both Ki67 expression and dNLR.
Abbreviations: dNLR, derived neutrophil–lymphocyte ratio; NPC, nasopharyngeal carcinoma.