Figures & data
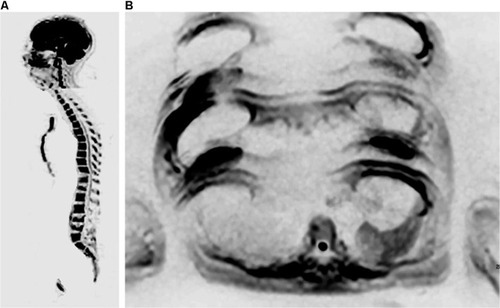
Figure 1 A 39-year-old female patient with a diagnosis of breast cancer, as well as bilateral mastectomy and breast prostheses implantation, undergoing chemotherapy. Notes: Whole-body MR with diffusion-weighted images (b800) with three-dimensional reformatted MIP in inverted grayscale in the coronal plane: multiple bone metastases in the ribs, spine, sacrum, pelvis, both scapulas and humeri. The mammary implants are also observed. The findings on bone scintigraphy were similar.
Abbreviations: MIP, maximum intensity projection; MR, magnetic resonance.
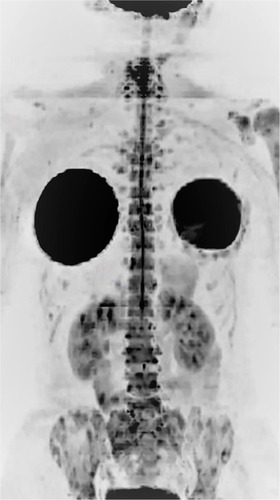
Figure 2 A 50-year-old female patient diagnosed with breast cancer, undergoing treatment with anastrozole and bisphosphonate.
Notes: Imaging evaluation performed in February 2017, after treatment initiation. ADC map in the axial plane showing in the same image a lesion in the right sacral wing with a high ADC value, suggestive of therapeutic response, and another lesion in the right ilium with a low ADC value, suggesting viable neoplastic tissue. Therefore, this case displays a heterogeneous response in the same patient.
Abbreviation: ADC, apparent diffusion coefficient.
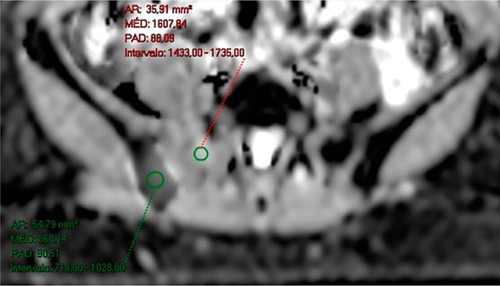
Figure 3 A 38-year-old female patient diagnosed with bilateral breast cancer in 2015 underwent a bilateral mastectomy and left axillary dissection in September 2015. Notes: The patient received chemotherapy from October 2015 to March 2016 and radiotherapy in June and July 2016 (28 sessions). She had already been treated with anastrozole and goserelin (March 2016 to June 2017) and initiated use of capecitabine in June 2017 and zoledronic acid in August 2017. She currently complains of lumbar pain. In (A), bone scintigraphy shows an unspecific and discrete focus of uptake in the left iliac crest. In (B) and (C), coronal and sagittal reformatted CT (June 2016) shows sclerotic areas in some vertebrae, the sternum, and ilium and partial collapse of L5, suggestive of lumbar metastasis. Whole-body MR showing discrete hypointense areas in sagittal T1 (D), without expression in sagittal STIR (E), and partial replacement of these lesions by fatty marrow in fat-fraction coronal T1 sequences (F and G). The diffusion-weighted sequence (b800) in inverted grayscale in the axial plane (H) shows no active lesions with diffusion restriction. The set of MR findings suggests lesions with a predominance of therapeutic response.
Abbreviations: CT, computed tomography; MR, magnetic resonance; STIR, short-tau inversion-recovery.
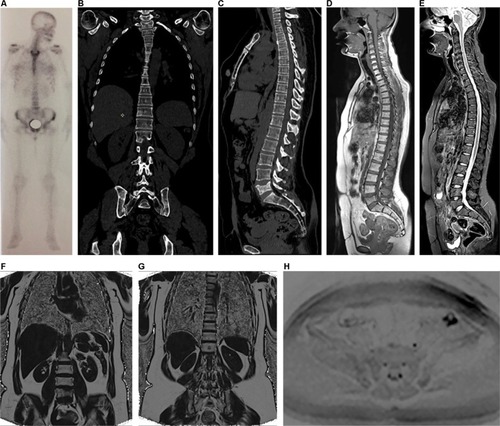
Figure 4 A 37-year-old female patient with left breast cancer and pain on breathing underwent investigation with whole-body MR and PET/CT.
Notes: Axial diffusion-weighted imaging (b800) in standard grayscale (A) shows a lesion with restricted diffusion in the sternum and enlarged axillary lymph nodes on the left, indicating secondary nodal and bone involvement. Coronal T1 out-of-phase sequence (B) shows enlargement of lymph nodes in the left axillary chain, one of which with loss of fatty hilum, also showing an adjacent round lymph node. PET/CT with a fusion of anatomical and functional images in the axial plane (C) showing increased FDG uptake in the body of the sternum, and magnified image at the left axillary level (D) showing lymph node with secondary neoplastic involvement presenting hypermetabolism.
Abbreviations: CT, computed tomography; FDG, fluorodeoxyglucose; MR, magnetic resonance; PET, positron emission tomography.
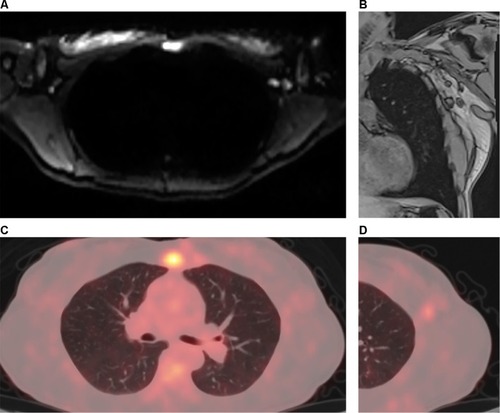
Figure 5 A 64-year-old female patient with a diagnosis of breast cancer, undergoing hormone therapy and with a complaint of bone pain.
Notes: Bone scintigraphy (A) shows increased uptake of technetium-99m in some vertebral bodies and in a left costal arch, which was suspicious for metastatic disease, as well as increased uptake in left femoral condyles, probably due to gonarthrosis. Whole-body MR performed at the same time shows secondary cancer diffusely distributed in the vertebral column in sagittal T1 and STIR sequences (B and C), more clearly defined than those shown on scintigraphy, as well as metastatic focus in the right ilium, which is observed in diffusion-weighted sequence (b800) in inverted grayscale in the axial plane (D) and was not detected by scintigraphy. Multiple hepatic metastases in the same diffusion-weighted sequence (E) are also observed.
Abbreviations: MR, magnetic resonance; STIR, short-tau inversion-recovery.
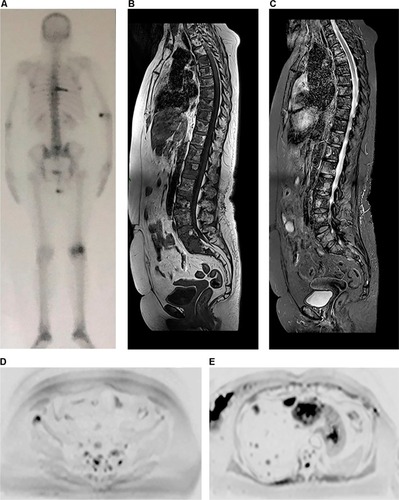
Figure 6 A 24-year-old female patient diagnosed with ER-positive, PR-positive, HER2-negative invasive ductal carcinoma of the left breast, with a complaint of headache.
Notes: The skull station in the FLAIR and T2 sequences in the axial plane (A and B) shows an expansive, heterogeneous lesion with solid peripheral areas and a central cystic/hemorrhagic portion, associated with perilesional edema, located in the parietal lobe. Brain metastases of breast and lung cancers may display areas of cystic degeneration, as in this case. ADC map in the axial plane (C and D) also demonstrates a metastatic lesion with diffusion restriction in right parietal bone.
Abbreviations: ADC, apparent diffusion coefficient; FLAIR, fluid-attenuated inversion-recovery.
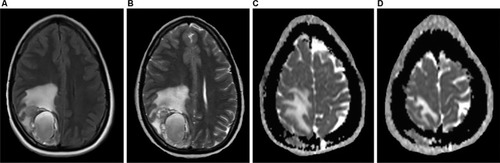
Figure 7 A 56-year-old female patient with a diagnosis of ER-positive, PR-positive, and HER2-negative invasive ductal carcinoma, undergoing treatment with anthracycline, cyclophosphamide, and tamoxifen.
Notes: On the first evaluation in March 2017, cervical spine MR with sagittal T1 and STIR sequences (A and B) show several bone lesions suggestive of metastases along this spine segment. A PET/CT performed in April 2017 showed numerous lesions in axial and proximal appendicular skeletons (C). Based on the PET/CT result, treatment with an aromatase inhibitor, bisphosphonate (zoledronic acid), and target therapy with denosumab was initiated. In June 2017, the patient underwent whole-body MR (D–F). A follow-up analysis based on sagittal T1 sequences alone (A and D) yielded a false interpretation of disease progression due to a lower signal in the bone marrow (E). However, an evaluation of (E) along with the diffusion-weighted sequence (b800) with reformatted MIP in inverted grayscale (F) shows that the latter has no signs of viable tumor tissue in the cervical spine; also, in comparison with the PET/CT images, the number of bone lesions is substantially lower, suggesting a partial response. In other words, a pattern of pseudoprogression is suggested if the T1-weighted sequences are considered alone.
Abbreviations: CT, computed tomography; FDG, fluorodeoxyglucose; MIP, maximum intensity projection; MR, magnetic resonance; PET, positron emission tomography; STIR, short-tau inversion-recovery.
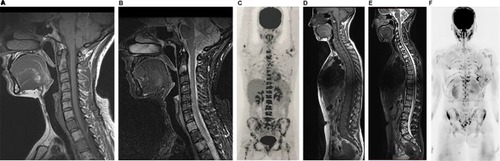
Figure 8 Illustrative diagram showing curves of hypothetical histogram analysis before treatment (Curve 1) and after treatment (Curve 2), the latter showing a partial therapeutic response.
Notes: The curves are divided into three tracks: one above 1,500 µm2/s, another between 1,500 µm2/s and the 95th percentile of the baseline (pre-treatment) curve, and the third one below the 95th percentile. The range above 1,500 µm2/s is considered as a response with tissue necrosis (highly probable response to the treatment), the intermediate range as microscopic cellular necrosis (likely response), and the range below the 95th percentile as viable tumor tissue (absence of response). The red area under Curve 2 corresponds to pixels of metastatic lesions without response to the administered treatment, ie, with viable neoplastic tissue. The yellow and green areas under Curve 2 correspond to pixels of metastatic lesions with a likely and highly likely response, respectively.
Abbreviation: ADC, apparent diffusion coefficient.
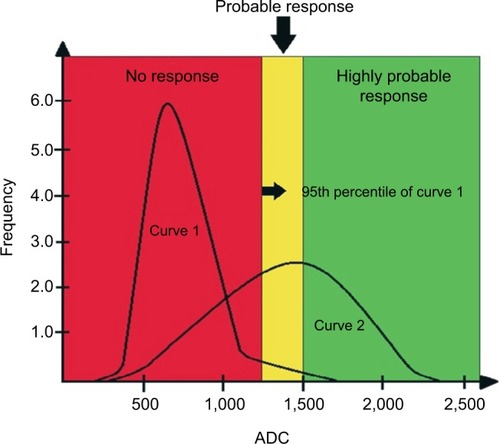
Figure 9 A 50-year-old female patient diagnosed with breast cancer, undergoing treatment with anastrozole and bisphosphonate. Evaluation performed in February 2017 after treatment initiation.
Notes: T1-Dixon sequence with fat-fraction map showing a heterogeneous response in the same patient. Metastatic lesions are shown in the dorsal spine, which did not respond to treatment in (A) and (B), while other metastases in the lumbar spine had a good response in (C) and (D).
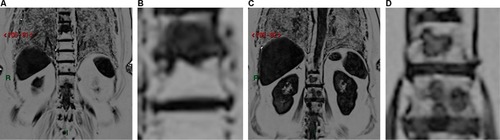
Figure 10 A 60-year-old female patient diagnosed with an ER-positive, HER2-negative infiltrating lobular breast carcinoma underwent quadrantectomy and axillary dissection in 2009.
Notes: The patient underwent four cycles of chemotherapy, 35 cycles of radiotherapy, and was treated with an aromatase inhibitor for 5 years. In 2015, she was diagnosed with metastasis to the vertebral spine, was treated with a bisphosphonate, and underwent radiotherapy. In 2016, she received another cycle of radiotherapy delivered to the vertebral spine. Sagittal T1 sequence (A) shows multiple hypointense lesions in the vertebral spine, which are hyperintense in the sagittal STIR sequence (B). Diffusion-weighted sequence (b800) in inverted grayscale in the axial plane (C and D) showing the lesions as foci of diffusion restriction in the sacrum and ilium (D). Axial ADC map (E and F) shows low signal intensity in these lesions (F), suggesting viable tumor tissue. In (A), the dorsal spine presents homogeneous fat replacement in the bone marrow, limited to the area irradiated during treatment, an example of late post-actinic change.
Abbreviations: ADC, apparent diffusion coefficient; STIR, short-tau inversion-recovery.
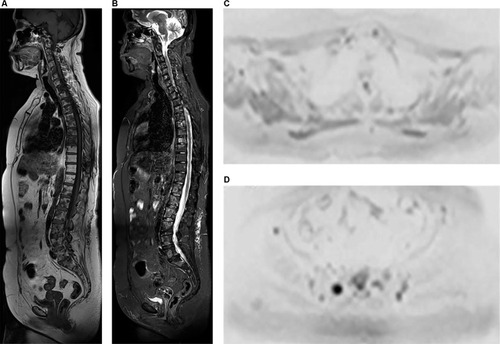
Figure 11 A 71-year-old female patient, undergoing treatment with G-CSF, underwent whole-body MR with diffusion-weighted images (b800) with three-dimensional reformatted MIP in inverted grayscale in the coronal plane (A) and post-processing with fusion of in-phase T1 sequence and b800 diffusion-weighted sequence in the coronal plane (B) showing diffuse hyperplasia of the hematopoietic marrow secondary to the use of G-CSF, characterized by extensive diffusion restriction in bone structures.
Note: The spleen and salivary glands have restricted diffusion even in the absence of disease, as shown.
Abbreviations: G-CSF, granulocyte colony-stimulating factor; MIP, maximum intensity projection; MR, magnetic resonance.
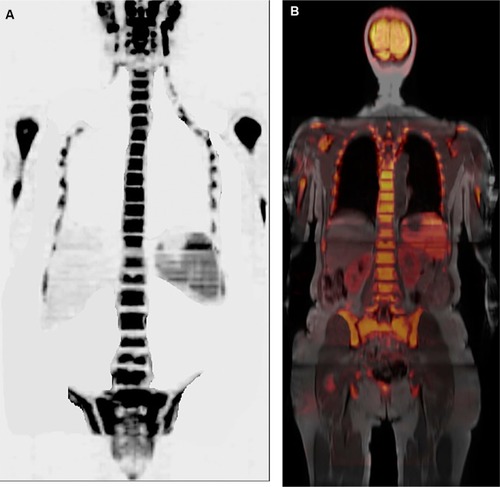
Figure 12 Different artifacts may appear on diffusion-weighted images.
Notes: (A) Whole-body MR with diffusion-weighted images (b800) with three-dimensional reformatted MIP in inverted grayscale in the sagittal plane of a 71-year-old female patient, undergoing treatment with G-CSF, displaying the broken spine artifact between head/neck and chest stations. There is also the collapse of some vertebral bodies caused by prior neoplastic involvement. In (B), whole-body MR with diffusion-weighted images (b800) with three-dimensional reformatted MIP in inverted grayscale in the axial plane of another 56-year-old female patient with a prior history of breast cancer, showing ghosting artifacts produced by the mammary prostheses. A metastatic focus with restricted diffusion was also observed in a vertebral body.
Abbreviations: MIP, maximum intensity projection; MR, magnetic resonance.