Figures & data
Table 1 Clinicopathological variables in 46 GBM patients
Figure 1 FOXA1 expression is upregulated in glioma tissues and cells.
Notes: (A) The expression of FOXA1 in tissues was established by qRT-PCR assay. FOXA1 expression in glioma tissues was higher than that in normal tissues. *p < 0.05, compared with normal tissues. (B) The expression of FOXA1 was determined using qRT-PCR and western blotting assay. FOXA1 expression was significantly higher in glioma cell lines U87-MG and U251 than that in normal glial cell, NHAs. *p < 0.05, compared with NHA cell lines. (C) The association between FOXA1 expression and the survival rate of GBM patients was measured using Kaplan-Meier method.
Abbreviations: FOXA1, forkhead box A1; GBM, glioblastomas multiforme; NHA, normal human astrocyte; qRT-PCR, quantitative reverse transcription-polymerase chain reaction.
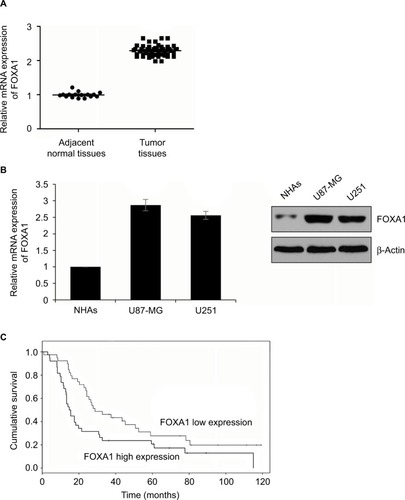
Figure 2 Upregulation of FOXA1 facilitates migration and invasive ability of glioma cells.
Notes: (A) and (B) FOXA1 over-expression and knockdown cells were successfully established. The expression of FOXA1 was established using qRT-PCR and western blotting assay. (C) Cell migration rate was markedly higher in FOXA1 over-expression group while was lower in FOXA1 inhibition group. Magnification ×10; scale bars =200 μm. (D) More invaded cells were seen in FOXA1 over-expression group, while there were less invaded cells in FOXA1 inhibition group. Magnification ×20; scale bars =100 μm. *p < 0.05, compared with vector or SCR group.
Abbreviations: FOXA1, forkhead box A1; qRT-PCR, quantitative reverse transcription-polymerase chain reaction; SCR, scramble siRNA.
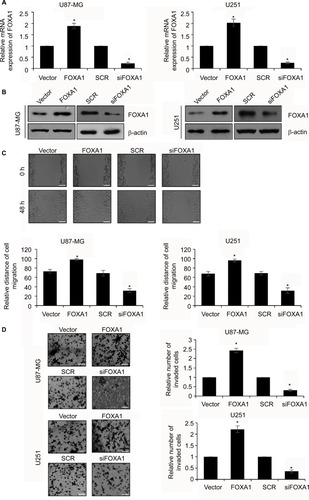
Figure 3 Ectopic expression of FOXA1 promotes cell proliferation of glioma cells through regulation of cell cycle.
Notes: (A) Cell viability was significantly stronger in FOXA1 over-expression group while was weaker in FOXA1 inhibition group. (B) The number of colonies was increased in FOXA1 over-expression group while was decreased in FOXA1 inhibition group. (C) Cell cycle progression of cells in FOXA1 inhibition was arrested in the G0/G1 phase. *p < 0.05, compared with vector or SCR group.
Abbreviations: FOXA1, forkhead box A1; SCR, scramble siRNA.
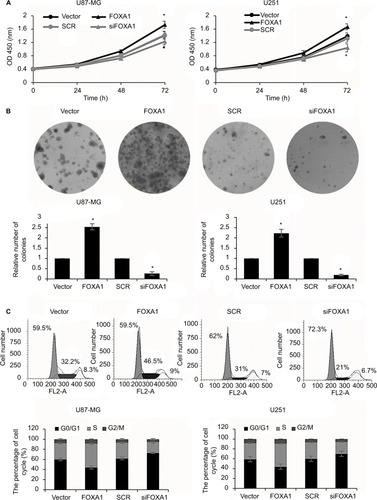
Figure 4 CCND1 is a direct target of FOXA1 in glioma cells.
Notes: (A) The expression of CCND1 in cells and tissues was established by qRT-PCR assay. CCND1 expression in glioma cells and tissues was higher than that in normal cells and tissues. *p < 0.05, compared with normal cells or tissues. (B) In cell lines U87-MG and U251, the protein expression of cyclin D1 was significantly lower in FOXA1 inhibition group. *p < 0.05, compared with SCR group. (C) ChIP and qChIP assay indicated that FOXA1 could directly bind to the promoter region of CCND1. *p < 0.05, compared with IgG group. (D) Validation of targeting relation between FOXA1 and CCND1 through a dual luciferase reporter assay. *p < 0.05, compared with vector group.
Abbreviations: FOXA1, forkhead box A1; NHA, normal human astrocyte; qRT-PCR, quantitative reverse transcription-polymerase chain reaction; SCR, scramble siRNA.
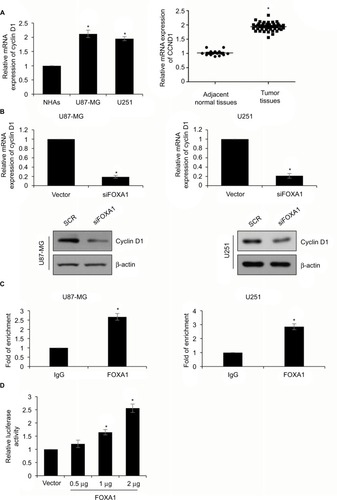
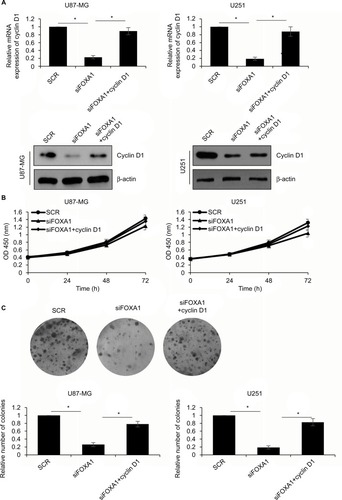
Figure 5 Over-expression of CCND1 partially attenuates FOXA1-depletion inhibited cell growth.
Notes: (A) CCND1 was overexpressed in FOXA1-depletion cells. The expression of CCND1 was established using qRT-PCR and western blotting. (B) CCK-8 assay showed that cell viability was rescued by CCND1 in FOXA1-depletion cells. (C) Colony formation assay demonstrated that the number of colonies was rescued by CCND1 in FOXA1-depletion cells. *p < 0.05, compared with SCR or siFOXA1 group.
Abbreviations: CCK-8, Cell Counting Kit-8; FOXA1, forkhead box A1; qRT-PCR, quantitative reverse transcription-polymerase chain reaction; SCR, scramble siRNA.