Figures & data
Table 1 Different expressions of microRNAs between nonmetastasis endometrial cancer and metastasis endometrial cancer
Table 2 Clinical characteristics of metastasis endometrial cancer patients
Figure 1 The miR-1247 expression between other organ metastasis tissues and lung metastasis tissues.
Note: *Mean P-value<0.05.
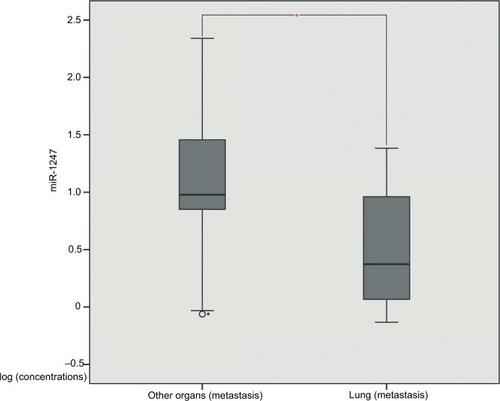
Figure 2 The target gene prediction and function analysis.
Notes: The overlapping target genes were predicted using TargetScan, miRDB, PicTar, and miRanda online analysis tools. (A) miRNA-150; (B) miRNA-301b; (C) miR-1247; and (D) miR-3200.
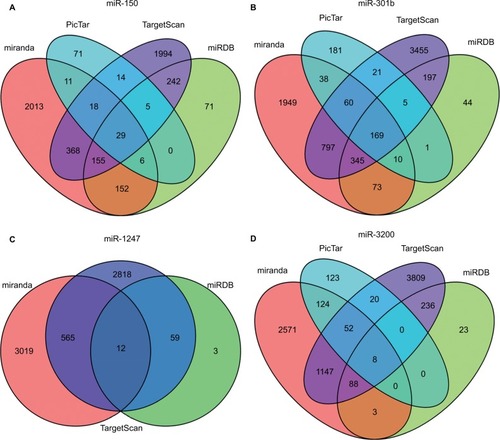
Figure 3 The GO and KEGG results.
Notes: (A) The significantly enriched KEGG pathways of target genes; (B) the significantly enriched GO biological processes of target genes.
Abbreviations: GO, Gene Ontology; KEGG, Kyoto Encyclopedia of Genes and Genomes.
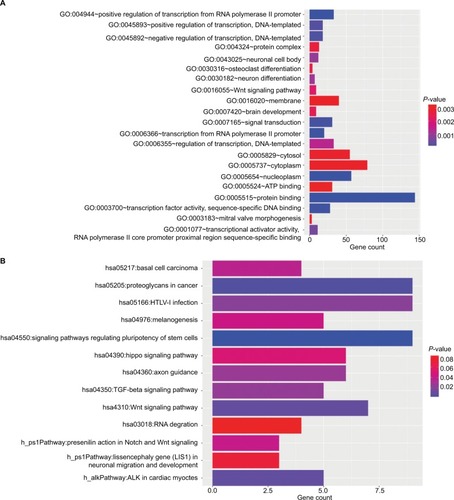
Figure 4 PPI interactions between predicted target genes of miR-301b.
Notes: Yellow color means linkages (in+out) are over than four (hub genes), red means overexpression gene, green means down-expression gene, and blue color means linkages are lower than four.
Abbreviation: PPI, protein–protein interaction.
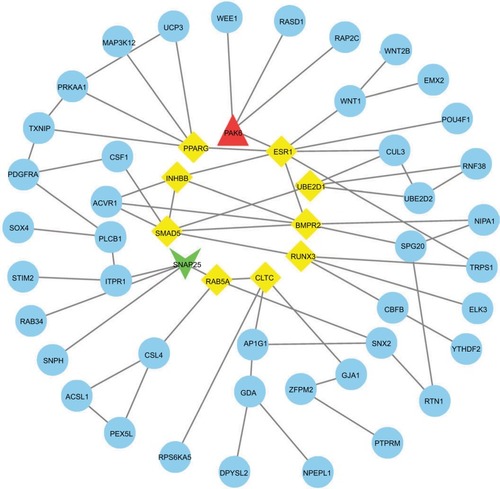
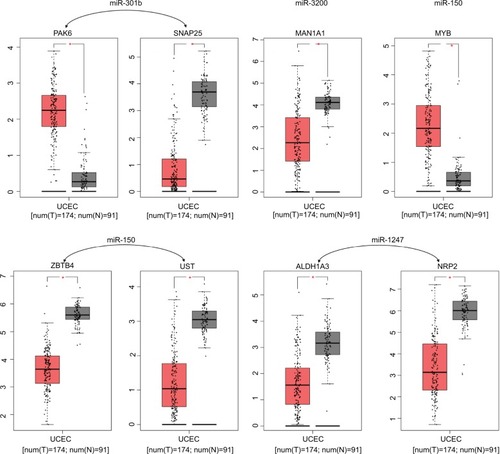
Figure 5 Expression differences between endometrial cancer and adjacent tissues.
Note: *Mean logFC >1.5, P-value <0.05.
Abbreviations: FC, fold change; UCEC, Uterine Corpus Endometrial Carcinoma.