Figures & data
Figure 1 Flowchart of patients’ screening.
Abbreviations: LN, lymph node; SEER, Surveillance, Epidemiology, and End Results.
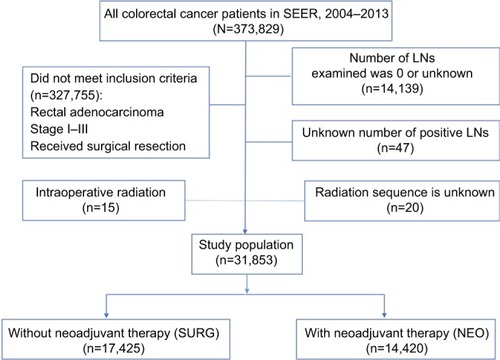
Table 1 Baseline patient clinicopathologic characteristics
Figure 2 Probability of missing nodal disease as a function of number of lymph nodes examined in a patient with truly lymph-positive disease for both SURG and NEO cohorts.
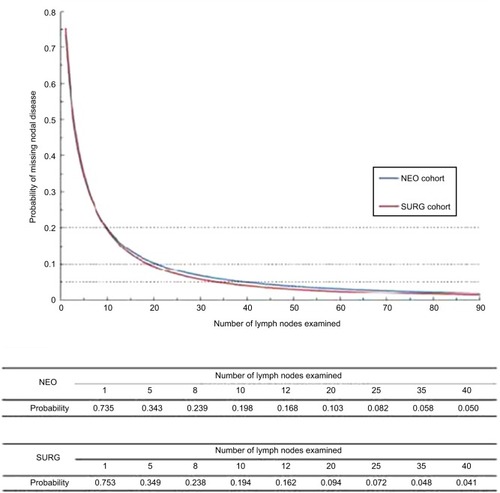
Table 2 Apparent and corrected prevalence of nodal disease
Figure 3 Probability of truly node-negative disease as a function of number of nodes examined on the basis of pathological tumor stage for patients in SURG cohort (A) and NEO cohort (B).
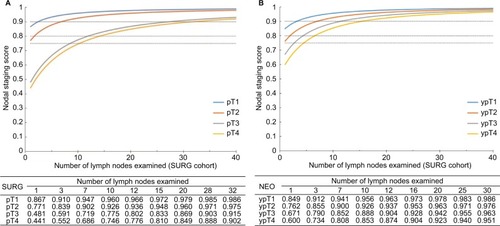
Figure 4 Survival probabilities as a function of the quartiles of the predictive values stratified by pT stage for patients in the SURG cohort.
Note: The quartiles were 0.941, 0.966, and 0.975 for pT1; 0.952, 0.968, and 0.996 for pT2; 0.957, 0.971, and 0.979 for pT3; and 0.957, 0.971, and 0.980 for pT4.
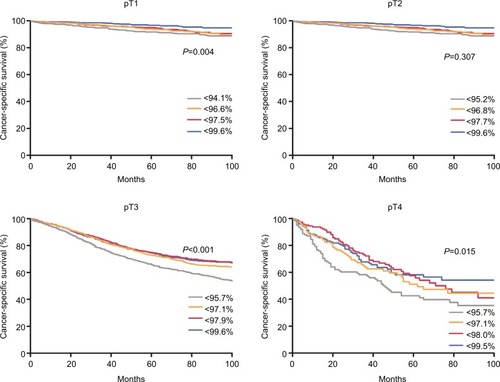
Figure 5 Survival probabilities as a function of the quartiles of the predictive values stratified by ypT stage for patients in NEO cohort.
Note: The quartiles were 0.924, 0.952, and 0.968 for ypT1; 0.933, 0.960, and 0.971 for ypT2; 0.941, 0.963, and 0.973 for ypT3; and 0.941, 0.960, and 0.974 for ypT4.
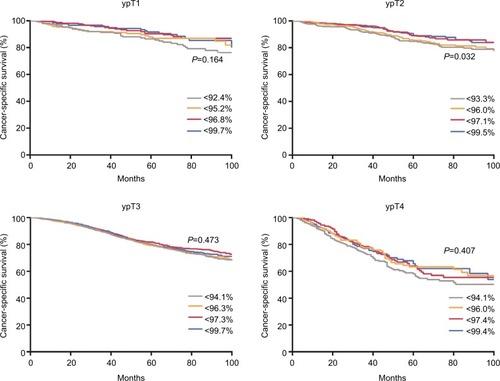
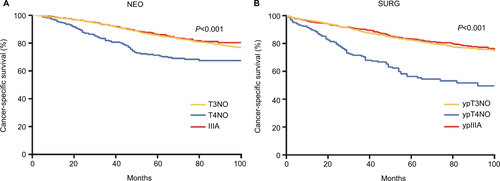
Figure S1 Cancer-specific survival analysis of pT4N0/ypT4N0 patients compared with patients at stage IIIA and pT3N0/ypT3N0 in both SURG (A) and NEO (B) cohorts.